


| Scenario | |
|---|---|
| Timeframe | Weekly |
| Recommendation | SELL STOP |
| Entry Point | 1.3610 |
| Take Profit | 1.3477, 1.3364 |
| Stop Loss | 1.3662 |
| Key Levels | 1.3364, 1.3477, 1.3612, 1.3766, 1.3864, 1.3976 |
| Alternative scenario | |
|---|---|
| Recommendation | BUY STOP |
| Entry Point | 1.3770 |
| Take Profit | 1.3864, 1.3976 |
| Stop Loss | 1.3716 |
| Key Levels | 1.3364, 1.3477, 1.3612, 1.3766, 1.3864, 1.3976 |
USD/CAD, H4
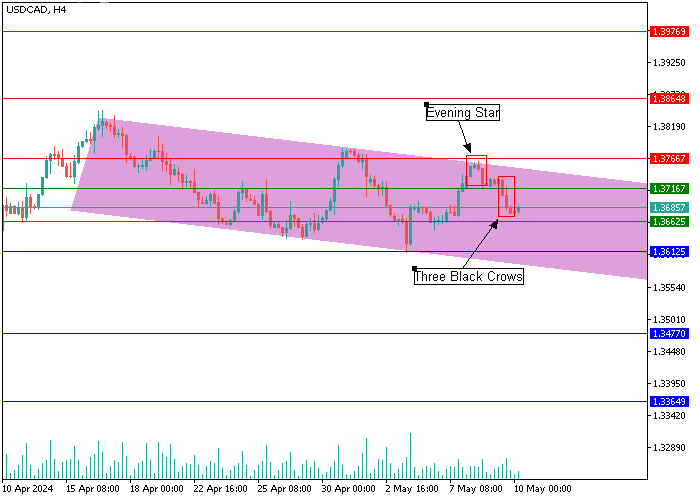
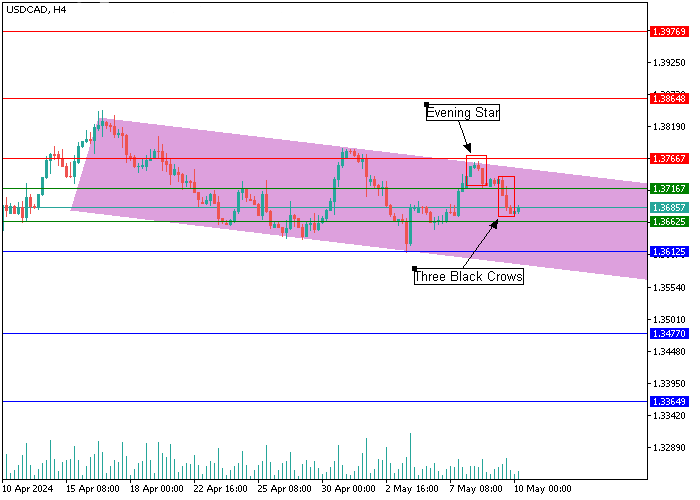
On the four-hour chart, a "bearish" trend is forming with decreasing highs and lows. Below the resistance level of 1.3766, a reversal pattern Evening Star appeared, which signals pressure on the price from sellers, and immediately behind it, at the level of 1.3716, a pattern of continuation of the downward trend Three Black Crows appeared, which demonstrates the desire of the "bears" to resume the downward movement. Most likely, quotes will continue their negative dynamics to the support level of 1.3612, overcoming which will become a catalyst for opening short positions with targets of 1.3477–1.3364. An alternative scenario is possible if the "bulls" restore positions above the level of 1.3766, which will mean a change in the short-term "bearish" trend; then one can expect a price increase in the range of 1.3864–1.3976.
USD/CAD, D1
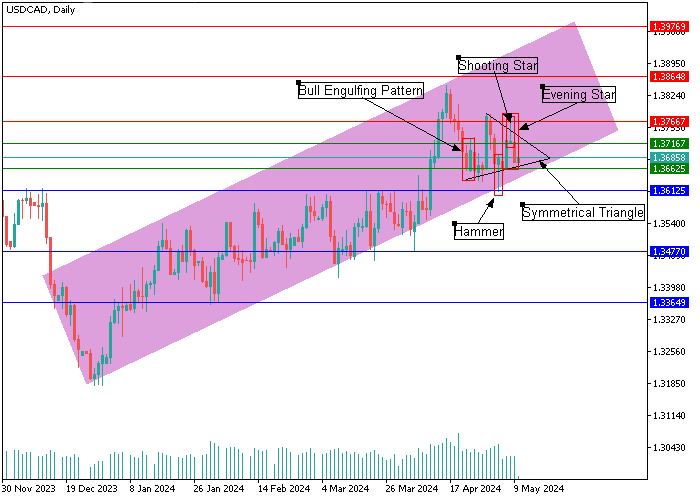
On the daily chart, mixed dynamics are observed: asset quotes fluctuate in the emerging Symmetrical Triangle pattern within the framework of an upward trend, the price exit from which can take place both up and down. It should be emphasized that the price inside the Triangle forms both "bullish" patterns - Bullish Engulfing, Hammer, and "bearish" reversal patterns - Evening Star, Shooting Star. To determine further possible dynamics of the instrument, it is necessary to overcome the upper or lower boundary of the Symmetrical Triangle pattern. Thus, it seems most likely that sellers will continue to attempt to consolidate positions below the level of 1.3612, breaking the lower boundary of a large upward trend. In this case, the movement will continue to the area of 1.3477–1.3364.
Support and resistance
Support levels: 1.3612, 1.3477, 1.3364.
Resistance levels: 1.3766, 1.3864, 1.3976.
Trading tips
Short positions can be opened below the level of 1.3612 with targets at 1.3477, 1.3364. Stop-loss — 1.3662. Implementation time: 9-12 days.
Long positions can be opened above 1.3766 with targets at 1.3864, 1.3976. Stop-loss — 1.3716.
免責事項:本記事で述べられている見解は著者の見解のみであり、Followmeの公式見解を反映するものではありません。Followmeは、提供された情報の正確性、完全性、信頼性について一切責任を負いません。また、書面で明示的に記載されている場合を除き、本記事の内容に基づいて行われたいかなる行動についても責任を負いません。

