


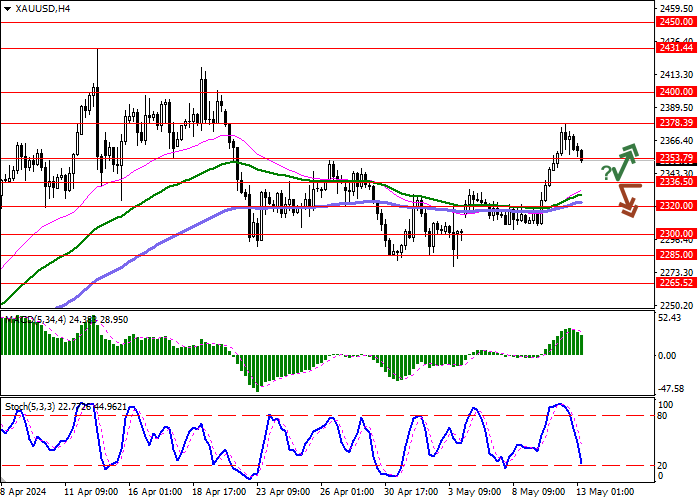
| Scenario | |
|---|---|
| Timeframe | Intraday |
| Recommendation | SELL STOP |
| Entry Point | 2336.50 |
| Take Profit | 2300.00 |
| Stop Loss | 2353.79 |
| Key Levels | 2300.00, 2320.00, 2336.50, 2353.79, 2378.39, 2400.00, 2431.44, 2450.00 |
| Alternative scenario | |
|---|---|
| Recommendation | BUY STOP |
| Entry Point | 2353.80 |
| Take Profit | 2378.39 |
| Stop Loss | 2336.50 |
| Key Levels | 2300.00, 2320.00, 2336.50, 2353.79, 2378.39, 2400.00, 2431.44, 2450.00 |
Current trend
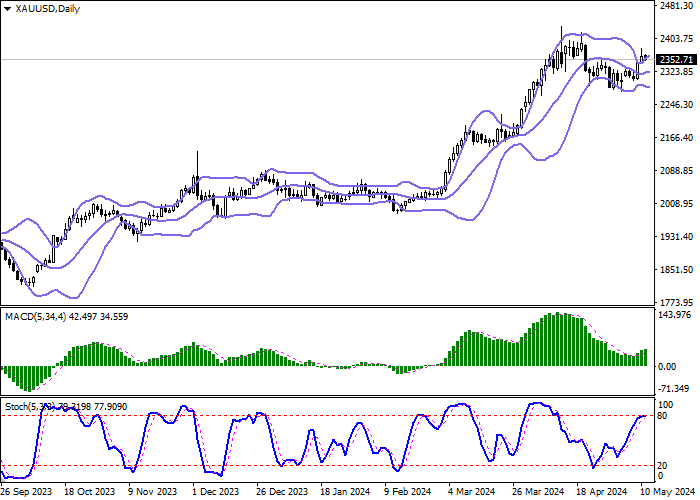
The XAU/USD pair is correcting, retreating from the local highs of April 22, updated at the end of last week. The instrument is testing 2350.00 for a breakdown, while trading participants expect the emergence of new drivers for the movement of quotes.
In particular, on Wednesday, May 15, the US will publish April inflation statistics: it is expected that the Consumer Price Index will slow down from 3.5% to 3.4% in annual terms and from 0.4% to 0.3% in monthly terms, and the Core CPI excluding volatile food and energy prices may be adjusted from 3.8% to 3.6% YoY and from 0.4% to 0.3% MoM, respectively. If analysts' forecasts come true or the rate of decline in consumer inflation turns out to be higher than expected, the dollar will be under noticeable pressure, as this will likely lead to a reassessment of the expected timing of the launch of the interest rate reduction program by the US Federal Reserve. For now, investors are still counting on at least two 25 basis point adjustments, the first of which is expected in September or November. Also, on Wednesday, April Retail Sales data will be presented in the US: the indicator is expected to slow down from 0.7% to 0.4%.
The ascending correction in the gold contract market continues. According to the report of the US Commodity Futures Trading Commission (CFTC), last week the number of net speculative positions in precious metal decreased to 199.6 thousand from 204.2 thousand a week earlier. Investors reduced their activity in anticipation of new drivers for the movement of quotes. The balance of the "bulls" in positions secured by real money amounted to 189.194 thousand versus 26.062 thousand for the "bears". Last week, buyers reduced the number of positions by 2.979 thousand contracts, while sellers increased it by 1.028 thousand.
Support and resistance
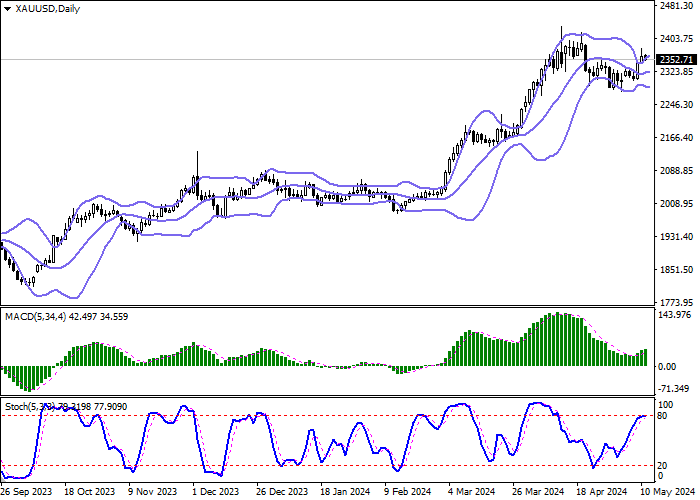
In the D1 chart, Bollinger Bands are reversing horizontally. The price range is expanding from above but it fails to conform to the development of "bullish" sentiments at the moment. MACD indicator is growing, while preserving a rather stable buy signal (located above the signal line). Stochastic retains its upward direction but is located near its highs, which indicates risks of overbought instrument in the ultra-short term.
Resistance levels: 2378.39, 2400.00, 2431.44, 2450.00.
Support levels: 2353.79, 2336.50, 2320.00, 2300.00.
Trading tips
Short positions may be opened after a breakdown of 2336.50 with the target at 2300.00. Stop-loss — 2353.79. Implementation time: 2-3 days.
A rebound from 2336.50 as from support followed by a breakout of 2353.79 may become a signal for opening new long positions with the target at 2378.39. Stop-loss — 2336.50.
免責事項:本記事で述べられている見解は著者の見解のみであり、Followmeの公式見解を反映するものではありません。Followmeは、提供された情報の正確性、完全性、信頼性について一切責任を負いません。また、書面で明示的に記載されている場合を除き、本記事の内容に基づいて行われたいかなる行動についても責任を負いません。

