Johnson Controls International plc, (JCI) engages in engineering, manufacturing, commissioning & retrofitting building products & systems in United States, Europe, Asia -Pacific & internationally. It operates in four segments like Building Solutions in North America, Building Solutions EMEA/LA, Building Solutions Asia-Pacific & Global products. It is based in Ireland, comes under Industrials sector & trades as “JCI” ticker at NYSE.
JCI favors short term upside in (1) of ((3)) against July-2022 low & expect to remain sideways to higher. Further bullish sequence will confirm when it breaks above $81.77 high.
JCI - Elliott Wave Latest Daily View: 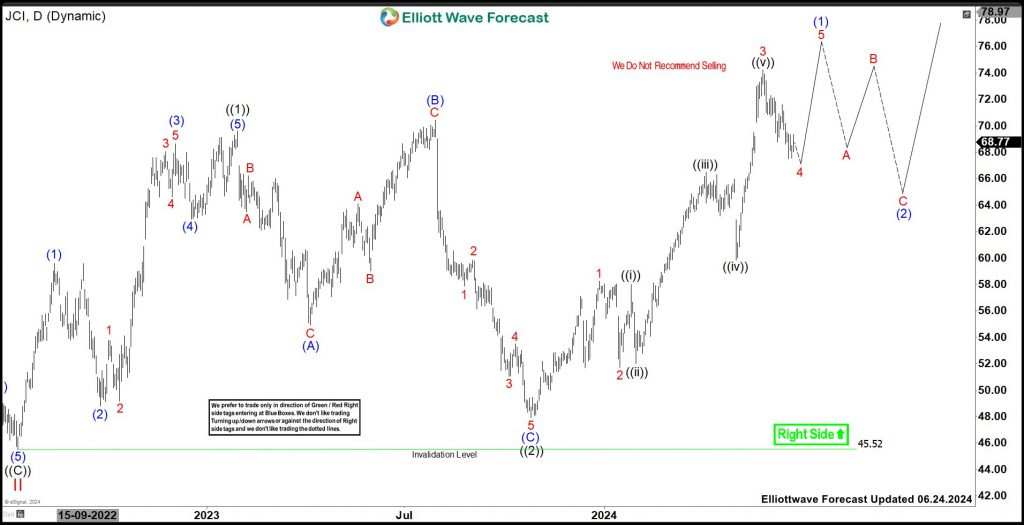
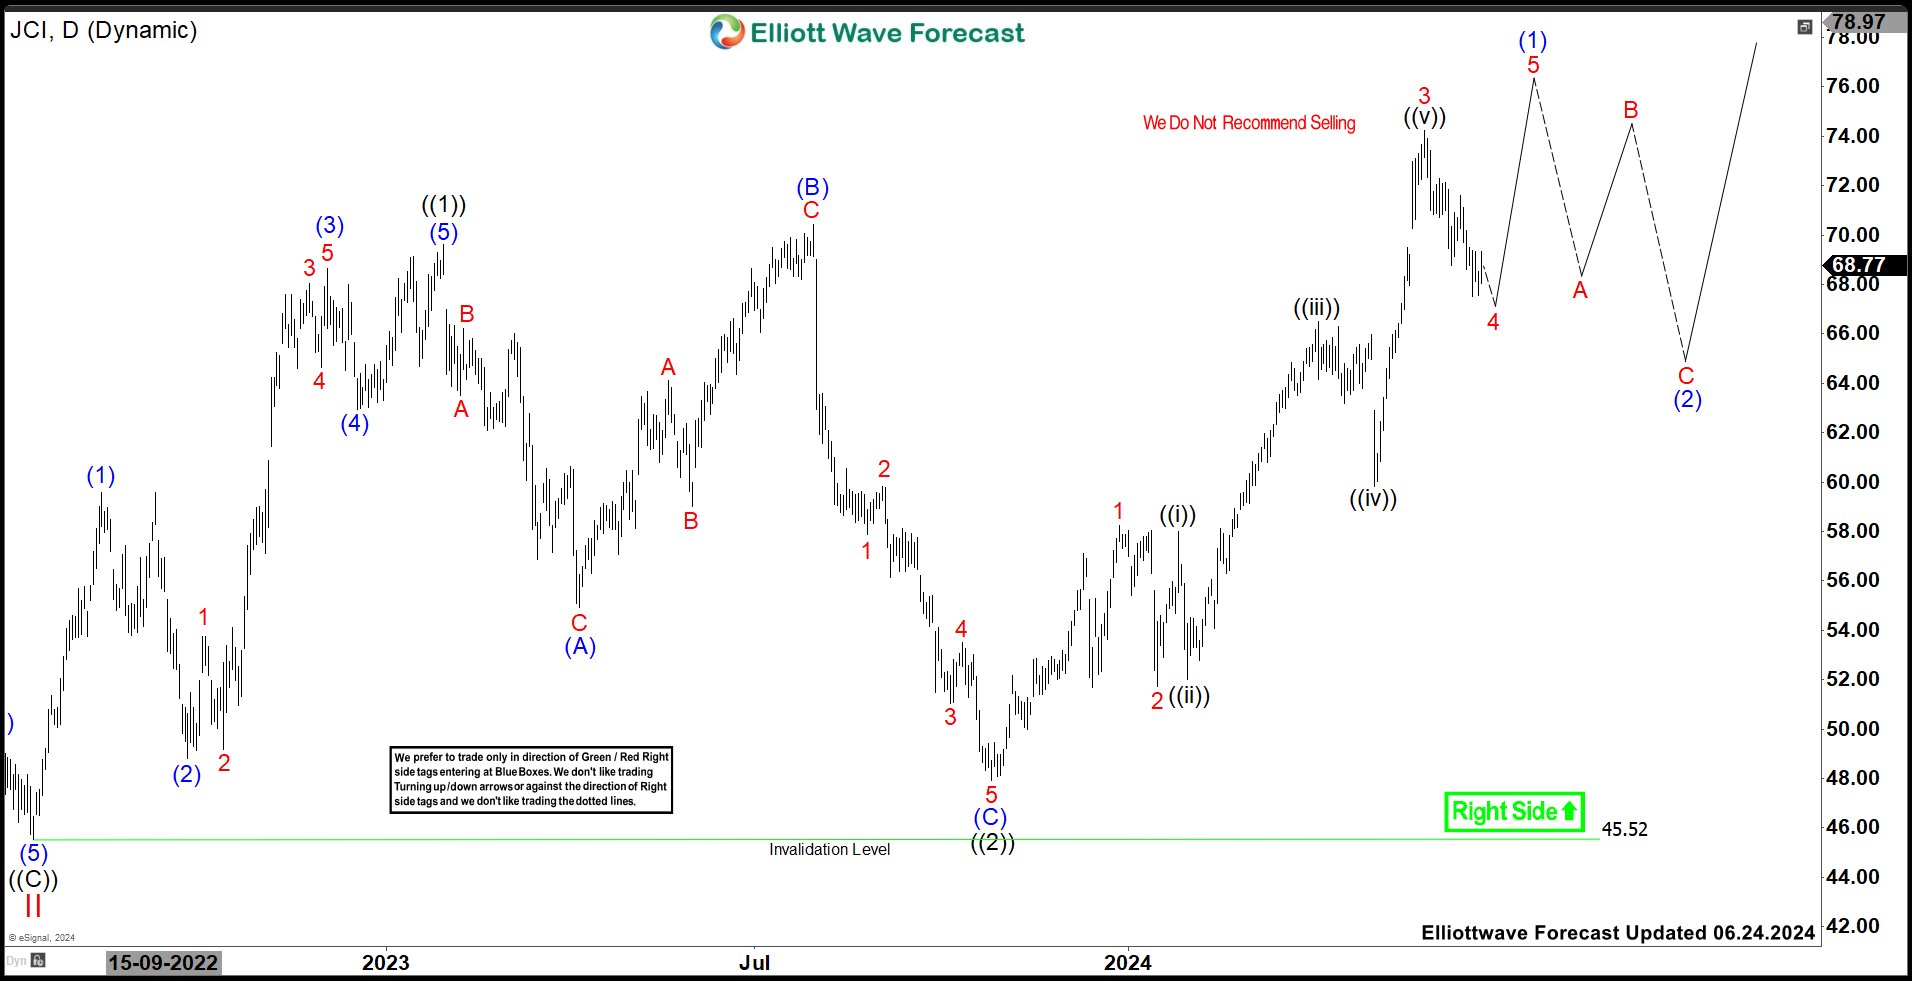
It placed (II) correction at $22.77 low in March-2020 against 2002 low as new impulse sequence higher. Above there, it placed I of (III) at $81.77 high & II correction at $45.52 low as 0.618 Fibonacci retracement in blue box area. Within I, it placed ((1)) at $31.34 high, ((2)) at $26.23 low, ((3)) extended wave at $81.15 high, ((4)) at $74.36 low & finally ((5)) as I at $81.77 high. It corrected II in zigzag correction. Above II low, it placed ((1)) of III at $69.60 high & ((2)) as flat correction at $47.90 low.
JCI - Elliott Wave Latest Weekly View: 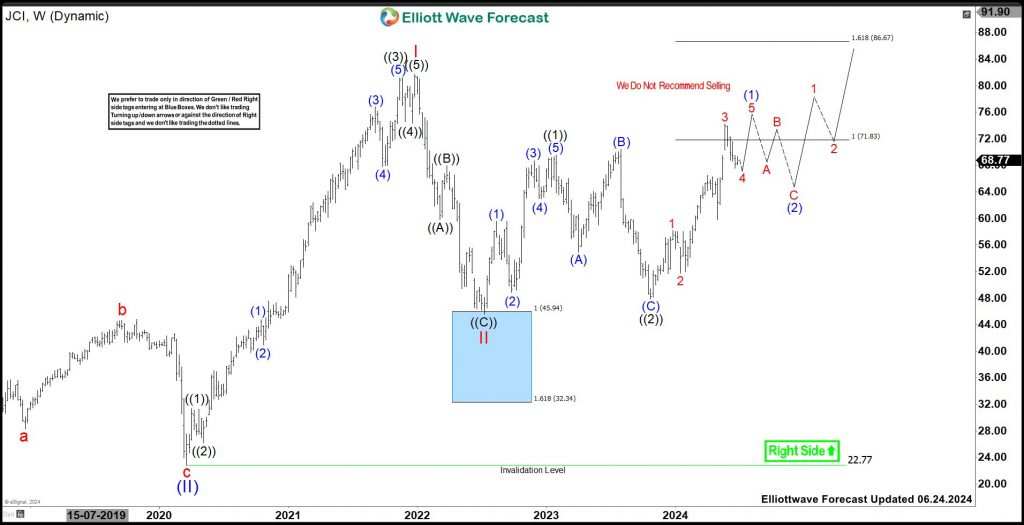

Above ((2)) low, it favors short term pullback in 4 & soon expect to turn higher in 5 of (1). It placed 1 of (1) at $58.23 high, 2 at $51.71 low & 3 of (1) at $74.23 high as extended wave. It expects small downside in current pullback before one more push higher to finish the (1) of ((3)). Further bullish sequence in weekly will confirm when it breaks above I high to be III of (III). In that case, we like to buy the pullback in 3, 7 or 11 swings. Alternatively, if it showing more price separation lower below $59.83, then it should be in (2) correction, while (1) ended at last high as it already reached the short term extreme areas.
免責事項:本記事で述べられている見解は著者の見解のみであり、Followmeの公式見解を反映するものではありません。Followmeは、提供された情報の正確性、完全性、信頼性について一切責任を負いません。また、書面で明示的に記載されている場合を除き、本記事の内容に基づいて行われたいかなる行動についても責任を負いません。

古いコメントはありません。ソファをつかむ最初のものになりましょう。