


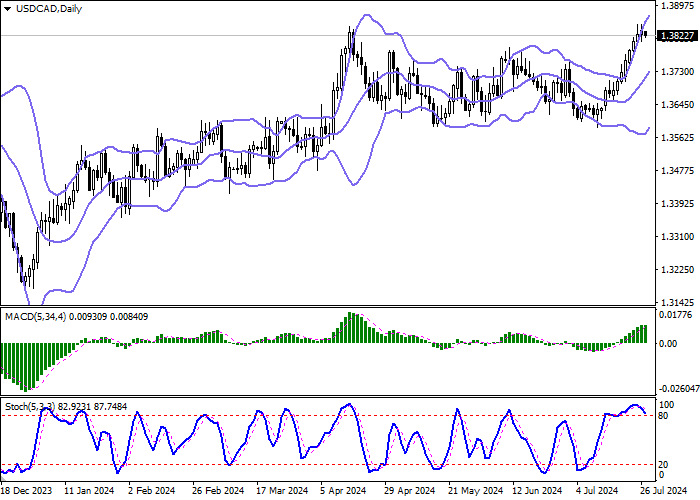
| Scenario | |
|---|---|
| Timeframe | Intraday |
| Recommendation | SELL STOP |
| Entry Point | 1.3800 |
| Take Profit | 1.3700 |
| Stop Loss | 1.3848 |
| Key Levels | 1.3700, 1.3733, 1.3762, 1.3800, 1.3848, 1.3900, 1.3950, 1.4000 |
| Alternative scenario | |
|---|---|
| Recommendation | BUY STOP |
| Entry Point | 1.3850 |
| Take Profit | 1.3950 |
| Stop Loss | 1.3800 |
| Key Levels | 1.3700, 1.3733, 1.3762, 1.3800, 1.3848, 1.3900, 1.3950, 1.4000 |
Current trend
During the Asian session, the USD/CAD pair is slightly declining, testing 1.3825 for a breakdown and holding around November highs, renewed at the end of last week, in anticipation of new drivers for movement.
On July 31, the US Fed will hold a monetary policy meeting. Experts assume that officials will keep the interest rate unchanged, considering the inflation data. The June core personal consumption expenditures price index accelerated from 0.1% to 0.2% MoM, exceeding analysts’ estimates, and remained at 2.6% YoY, contrary to forecasts of 2.5%. The overall indicator changed from 2.6% to 2.5% YoY and 0.0% to 0.1% MoM, respectively.
On Friday at 14:30 (GMT 2), investors will also be looking forward to the publication of the US labor market report. According to preliminary estimates, the July nonfarm payrolls from 206.0K to 185.0K, average hourly earnings remained at 0.3%, and the unemployment rate was at 4.1%. On Wednesday at 14:30 (GMT 2), traders will pay attention to Canadian statistics on the May gross domestic product (GDP), which may slow from 0.3% to 0.2% MoM.
Support and resistance
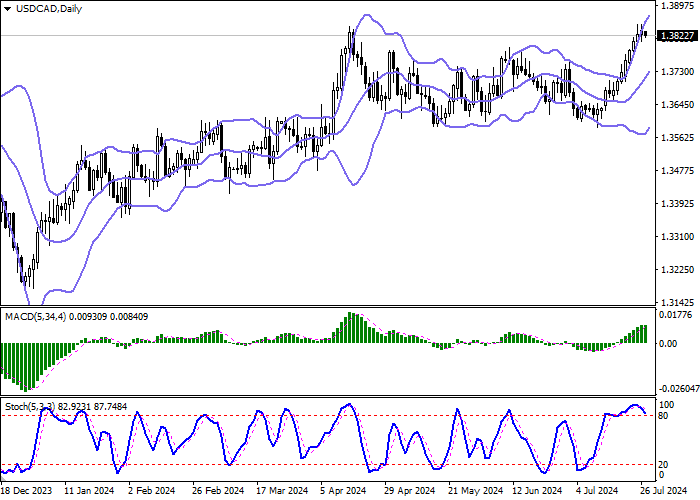
On the daily chart, Bollinger bands are growing. The price range is expanding from above, letting the “bulls” renew highs. The MACD indicator is growing, keeping a buy signal: the histogram is above the signal line. Stochastic is trying to reverse downwards, signaling in favor of a corrective decline in the ultra-short term.
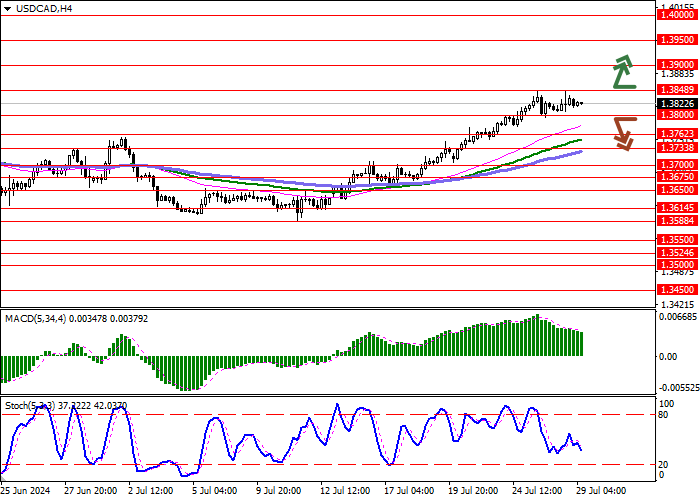
Resistance levels: 1.3848, 1.3900, 1.3950, 1.4000.
Support levels: 1.3800, 1.3762, 1.3733, 1.3700.
Trading tips
Short positions may be opened after a breakdown of 1.3800, with the target at 1.3700. Stop loss — 1.3848. Implementation period: 2–3 days.
Long positions may be opened after a breakout of 1.3848, with the target at 1.3950. Stop loss — 1.3800.
免責事項:本記事で述べられている見解は著者の見解のみであり、Followmeの公式見解を反映するものではありません。Followmeは、提供された情報の正確性、完全性、信頼性について一切責任を負いません。また、書面で明示的に記載されている場合を除き、本記事の内容に基づいて行われたいかなる行動についても責任を負いません。

