



| Scenario | |
|---|---|
| Timeframe | Intraday |
| Recommendation | BUY STOP |
| Entry Point | 0.8900 |
| Take Profit | 0.8964 |
| Stop Loss | 0.8865 |
| Key Levels | 0.8750, 0.8776, 0.8800, 0.8839, 0.8865, 0.8900, 0.8935, 0.8964 |
| Alternative scenario | |
|---|---|
| Recommendation | SELL |
| Entry Point | 0.8863 |
| Take Profit | 0.8800 |
| Stop Loss | 0.8900 |
| Key Levels | 0.8750, 0.8776, 0.8800, 0.8839, 0.8865, 0.8900, 0.8935, 0.8964 |
Current trend
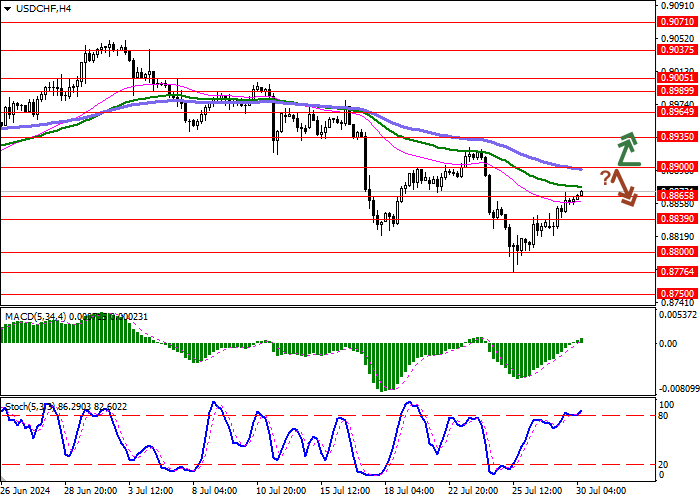
The USD/CHF pair is developing the correction impulse of the previous week and is testing 0.8870 for a breakout while traders are waiting for new drivers to emerge.
Tomorrow at 20:00 (GMT 2), the results of the US Fed meeting are due. Analysts are confident that officials will keep the interest rate at 5.5% but expect to receive confirmation of the upcoming easing of monetary policy in September. At the end of the week, investors will pay attention to the labor market report for July: forecasts suggest a slowdown in the nonfarm payrolls from 206.0K to 175.0K and wages – from 3.9% to 3.7% YoY, but it may remain at 0.3% MoM.
On Friday, data on the dynamics of consumer inflation in Switzerland is due. According to preliminary estimates, the consumer price index will not change in July, amounting to 1.3% YoY, and will decrease from 0.0% to –0.2% MoM.
Support and resistance
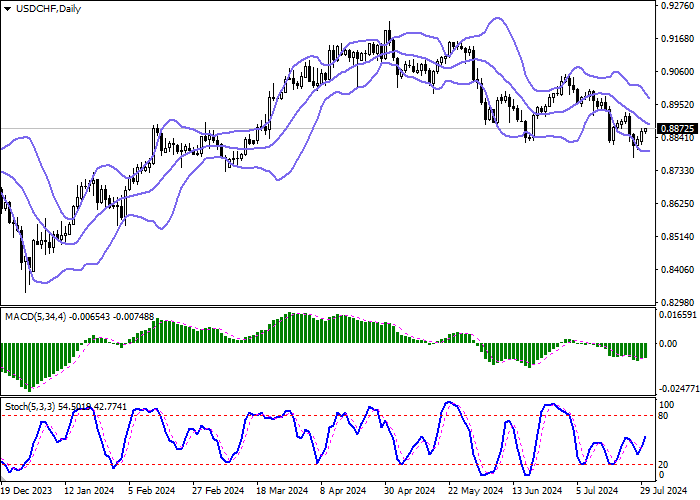
On the daily chart, Bollinger bands are trying to reverse into a horizontal plane: the price range is narrowing, reflecting the emergence of ambiguous trading dynamics in the short and ultra-short term. The MACD indicator is growing, keeping a poor buy signal (the histogram is above the signal line). Stochastic demonstrates similar dynamics, located approximately in the center of the working area, which signals the possibility of an upward correction.
Resistance levels: 0.8865, 0.8900, 0.8935, 0.8964.
Support levels: 0.8839, 0.8800, 0.8776, 0.8750.
Trading tips
Long positions may be opened after a confident breakout of the 0.8900 level upwards, with the target at 0.8964. Stop loss – 0.8865. Implementation period: 2–3 days.
Short positions may be opened after a rebound from the 0.8900 level and a breakout of the 0.8865 mark downwards, with the target at 0.8800. Stop loss – 0.8900.
免責事項:本記事で述べられている見解は著者の見解のみであり、Followmeの公式見解を反映するものではありません。Followmeは、提供された情報の正確性、完全性、信頼性について一切責任を負いません。また、書面で明示的に記載されている場合を除き、本記事の内容に基づいて行われたいかなる行動についても責任を負いません。

