· Views 122
免責事項:本記事で述べられている見解は著者の見解のみであり、Followmeの公式見解を反映するものではありません。Followmeは、提供された情報の正確性、完全性、信頼性について一切責任を負いません。また、書面で明示的に記載されている場合を除き、本記事の内容に基づいて行われたいかなる行動についても責任を負いません。
この記事が気に入ったら、著者にチップを送って感謝の気持ちを表しましょう。

| Scenario | |
|---|---|
| Timeframe | Weekly |
| Recommendation | BUY STOP |
| Entry Point | 117.50 |
| Take Profit | 127.00 |
| Stop Loss | 114.00 |
| Key Levels | 104.00, 105.00, 109.70, 113.40, 115.00, 117.50, 118.00, 120.00, 127.00 |
| Alternative scenario | |
|---|---|
| Recommendation | SELL STOP |
| Entry Point | 113.40 |
| Take Profit | 105.00 |
| Stop Loss | 116.00 |
| Key Levels | 104.00, 105.00, 109.70, 113.40, 115.00, 117.50, 118.00, 120.00, 127.00 |
The shares of RTX Corp., an American aerospace and defense conglomerate, are trading at 115.00.
On the daily chart, the price is correcting upwards, holding below the resistance line of the ascending channel 120.00–104.00.
On the four-hour chart, this movement has turned into a trend, confirmed by the recent price gap of 109.70–104.00, which wasn’t worked out. The target for the trend may be an exit from the channel with the quotes consolidation above 118.00.
Technical indicators are holding the buy signal: the fast EMA on the Alligator indicator are above the signal line, and the AO histogram is forming correction bars in the buy zone.
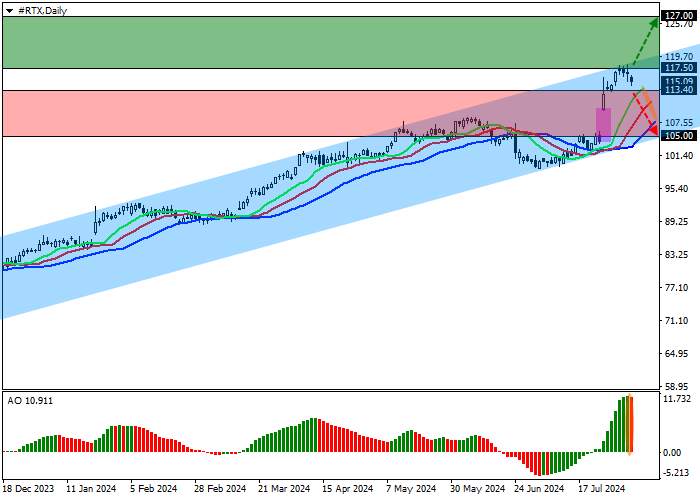
Trading tips
Long positions may be opened after the price grows and consolidates above the 117.50 level, with the target at 127.00. Stop loss — 114.00. Implementation period: 7 days or more.
Short positions may be opened after the price declines and consolidates below 113.40, with the target at 105.00. Stop loss — 116.00.
免責事項:本記事で述べられている見解は著者の見解のみであり、Followmeの公式見解を反映するものではありません。Followmeは、提供された情報の正確性、完全性、信頼性について一切責任を負いません。また、書面で明示的に記載されている場合を除き、本記事の内容に基づいて行われたいかなる行動についても責任を負いません。

古いコメントはありません。ソファをつかむ最初のものになりましょう。