· Views 77
免責事項:本記事で述べられている見解は著者の見解のみであり、Followmeの公式見解を反映するものではありません。Followmeは、提供された情報の正確性、完全性、信頼性について一切責任を負いません。また、書面で明示的に記載されている場合を除き、本記事の内容に基づいて行われたいかなる行動についても責任を負いません。
この記事が気に入ったら、著者にチップを送って感謝の気持ちを表しましょう。

| Scenario | |
|---|---|
| Timeframe | Weekly |
| Recommendation | BUY STOP |
| Entry Point | 50.20 |
| Take Profit | 52.30 |
| Stop Loss | 49.00 |
| Key Levels | 43.60, 45.30, 48.60, 48.80, 49.00, 49.50, 50.20, 52.30 |
| Alternative scenario | |
|---|---|
| Recommendation | SELL STOP |
| Entry Point | 49.00 |
| Take Profit | 44.70 |
| Stop Loss | 51.00 |
| Key Levels | 43.60, 45.30, 48.60, 48.80, 49.00, 49.50, 50.20, 52.30 |
Shares of Cisco Systems Inc., an American manufacturer and supplier of network equipment for large holdings and telecommunications companies, are trading around 49.50.
On the daily chart, the price tries to leave the downward channel with dynamic boundaries of 48.60–43.60.
On the four-hour chart, the quotes have consolidated above the previous high of 48.80, which is an indirect confirmation of the exit from the range. In addition, the recently formed price gap between the 48.50 and 45.30 marks gives confidence in the strengthening of the upward movement.
Technical indicators gave a signal to open long positions last week: fast EMA on the Alligator indicator crossed the signal line upwards, and the AO oscillator histogram forms new correction bars, rising in the buy zone.
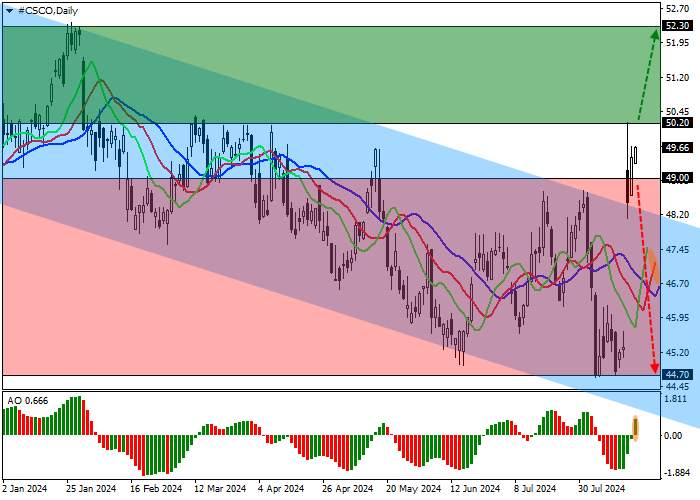
Trading tips
Long positions may be opened after the price consolidates above the resistance level of 50.20, with the target at 52.30. Stop loss – 49.00. Implementation period: 7 days or more.
Short positions may be opened after the price consolidates below the support level of 49.00, with the target at 44.70. Stop loss – 51.00.
免責事項:本記事で述べられている見解は著者の見解のみであり、Followmeの公式見解を反映するものではありません。Followmeは、提供された情報の正確性、完全性、信頼性について一切責任を負いません。また、書面で明示的に記載されている場合を除き、本記事の内容に基づいて行われたいかなる行動についても責任を負いません。

古いコメントはありません。ソファをつかむ最初のものになりましょう。