


| Scenario | |
|---|---|
| Timeframe | Weekly |
| Recommendation | SELL STOP |
| Entry Point | 1.3570 |
| Take Profit | 1.3460 |
| Stop Loss | 1.3620 |
| Key Levels | 1.3460, 1.3570, 1.3630, 1.3780 |
| Alternative scenario | |
|---|---|
| Recommendation | BUY STOP |
| Entry Point | 1.3630 |
| Take Profit | 1.3780 |
| Stop Loss | 1.3570 |
| Key Levels | 1.3460, 1.3570, 1.3630, 1.3780 |
Current trend
The USD/CAD pair is correcting downwards, holding at 1.3593 during the Asian session amid positive macroeconomic statistics from Canada.
Thus, in July, prices for products manufactured in the country, measured by the IPPI index, did not change but compared to the same indicator a year earlier, the growth was 2.9%. In turn, the cost of raw materials purchased by local producers, calculated using the RMPI indicator, increased by 0.7% MoM and by 4.1% YoY, reflecting the positive dynamics in the national economy and acting as a driver of growth in Canadian currency the quotes.
Meanwhile, the American dollar strengthened slightly, and today, it is again testing 101.2 in USDX. The quotes were supported by reports on the labor and real estate markets, which exceeded analysts’ forecasts, during yesterday’s trading. Thus, the initial jobless claims amounted to 232.0K, which coincided with preliminary calculations but was slightly higher than the 228.0K shown last week. Against this background, the total claims reached 1.863M people, exceeding the 1.870M expected by analysts but inferior to last week’s figure of 1.859M. It confirmed the cooling of the sector, which is also a condition for adjusting monetary policy at the next meeting of the US Fed in September. In turn, sales in the secondary housing market increased by 3.95M by July, better than 3.90M last month.
Support and resistance
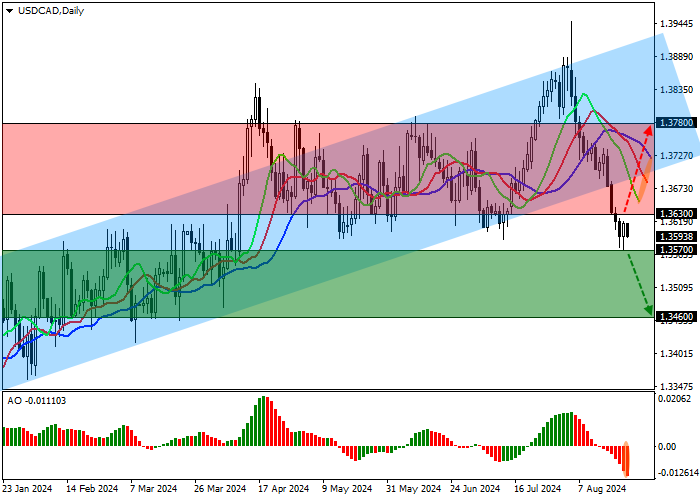
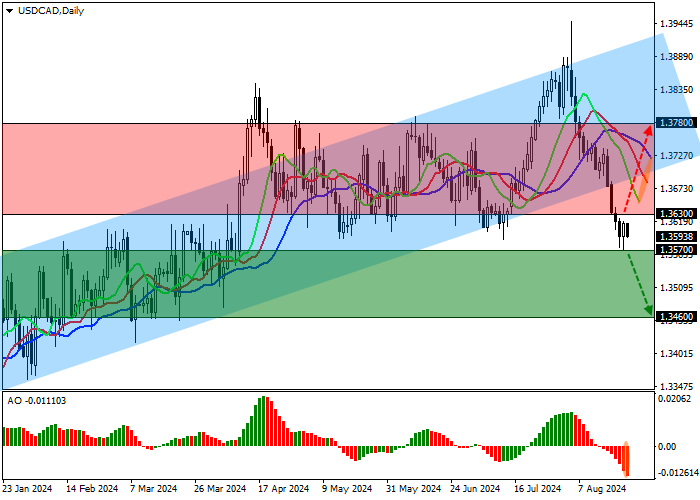
On the daily chart, the price is moving away from the support line of the ascending channel with dynamic boundaries of 1.3920–1.3690.
Technical indicators are strengthening the sell signal: the EMA oscillation range on the Alligator indicator is expanding downwards, and the AO oscillator histogram is forming new downward bars, being below the transition level.
Support levels: 1.3570, 1.3460.
Resistance levels: 1.3630, 1.3780.
Trading tips
Short positions may be opened after the price consolidates below the support level of 1.3570, with the target at 1.3460. Stop loss — 1.3620. Implementation period: 7 days or more.
Long positions may be opened after the price consolidates above 1.3630, with the target at the resistance level of 1.3780. Stop loss – 1.3570.
免責事項:本記事で述べられている見解は著者の見解のみであり、Followmeの公式見解を反映するものではありません。Followmeは、提供された情報の正確性、完全性、信頼性について一切責任を負いません。また、書面で明示的に記載されている場合を除き、本記事の内容に基づいて行われたいかなる行動についても責任を負いません。

