· Views 99
免責事項:本記事で述べられている見解は著者の見解のみであり、Followmeの公式見解を反映するものではありません。Followmeは、提供された情報の正確性、完全性、信頼性について一切責任を負いません。また、書面で明示的に記載されている場合を除き、本記事の内容に基づいて行われたいかなる行動についても責任を負いません。
この記事が気に入ったら、著者にチップを送って感謝の気持ちを表しましょう。
| Scenario | |
|---|---|
| Timeframe | Weekly |
| Recommendation | BUY STOP |
| Entry Point | 292.00 |
| Take Profit | 301.00 |
| Stop Loss | 286.00 |
| Key Levels | 243.00, 258.00, 270.00, 289.00, 290.00, 292.00, 301.00 |
| Alternative scenario | |
|---|---|
| Recommendation | SELL STOP |
| Entry Point | 285.00 |
| Take Profit | 275.00 |
| Stop Loss | 290.00 |
| Key Levels | 243.00, 258.00, 270.00, 289.00, 290.00, 292.00, 301.00 |
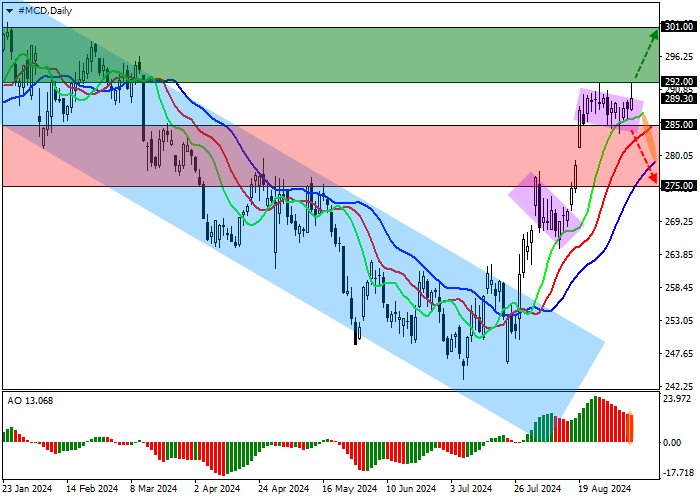
Shares of McDonald’s Corp., the largest fast food chain, are correcting in a local trend at 289.00.
On the daily chart, the price is retreating from the resistance line of the downwards channel 258.00–243.00, approaching annual highs.
On the four-hour chart, today there may be the first accentuated attempt to test the local high of 292.00. The probability of breakout the level is much higher than the decline. However, in case of a reversal, a correction to the support level of 270.00 is possible.
Technical indicators maintain a buy position: fast EMA on the Alligator indicator are above the signal line, and the AO histogram forms correction bars above the transition level.

Trading tips
Long positions may be opened after the price rises and consolidates above 292.00, with the target at 301.00. Stop loss is 286.00. Implementation period: 7 days or more.
Short positions may be opened after the price declines and consolidates below 285.00, with the target at 275.00. Stop loss — 290.00.
免責事項:本記事で述べられている見解は著者の見解のみであり、Followmeの公式見解を反映するものではありません。Followmeは、提供された情報の正確性、完全性、信頼性について一切責任を負いません。また、書面で明示的に記載されている場合を除き、本記事の内容に基づいて行われたいかなる行動についても責任を負いません。

古いコメントはありません。ソファをつかむ最初のものになりましょう。