


PENDLE is a DeFi protocol focused on yield trading, allowing users to both fix or leverage their yield. In today’s blog, we’ll explain the daily Elliott Wave structure taking place and show the potential outcome for the token.
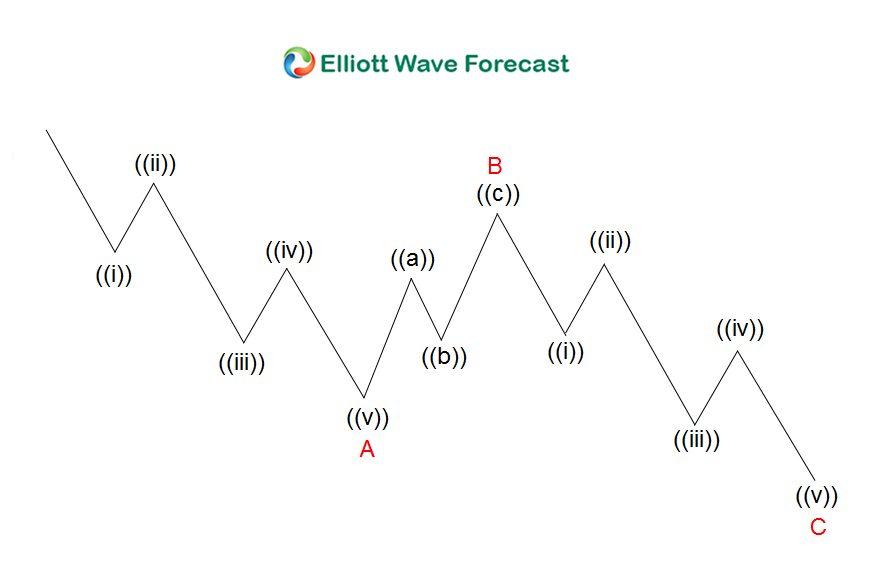
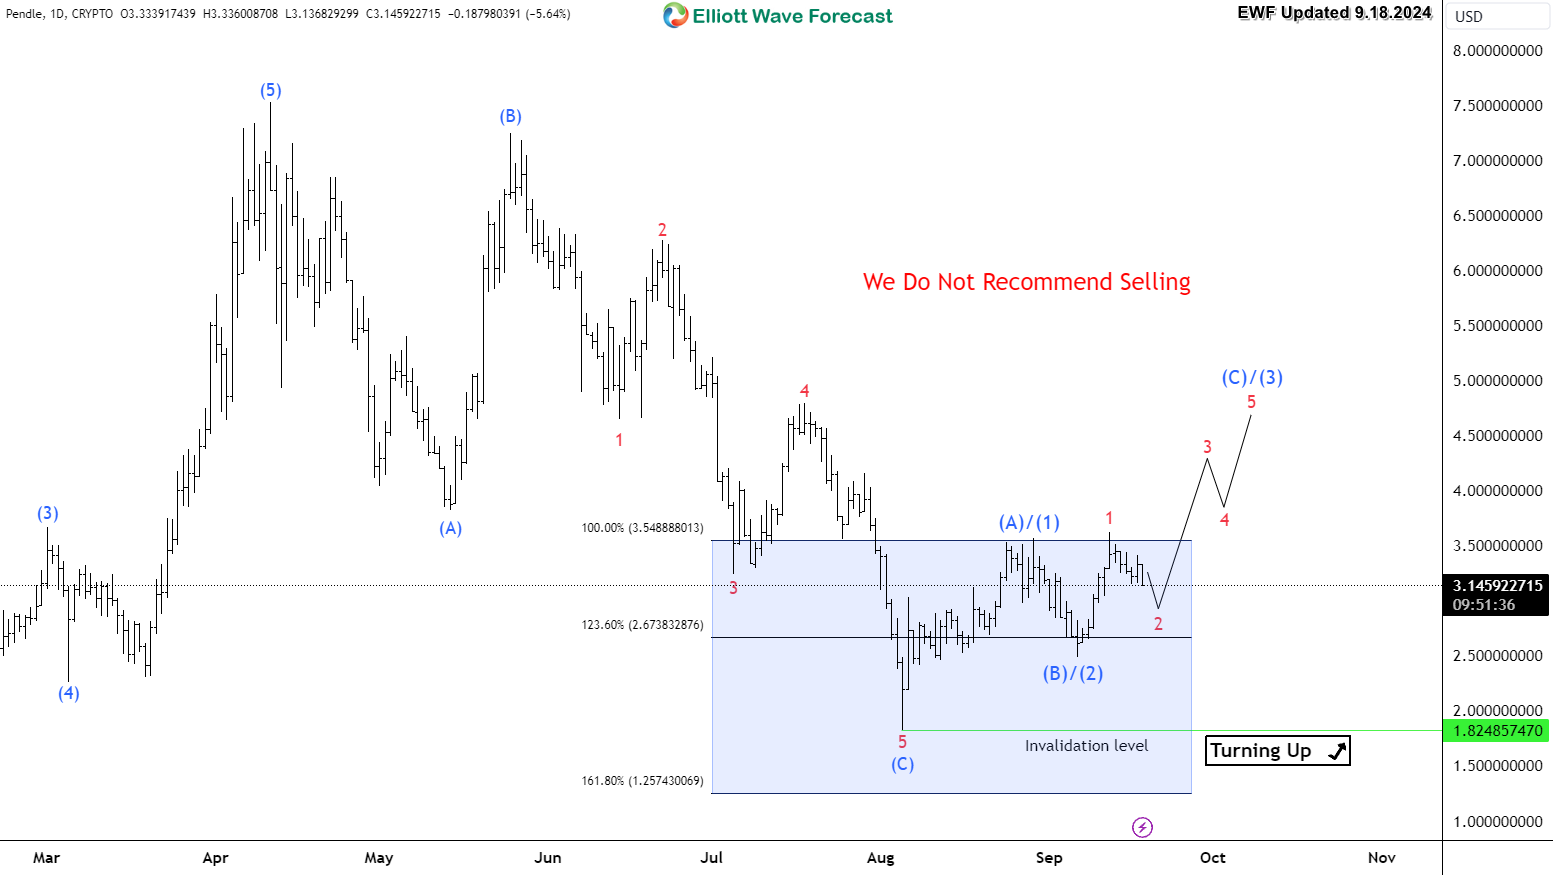
Since April 2024, PENDLE started its correction to the downside and it lost 75% of its value. The move from the peak unfolded within a 3 waves ZigZag structure. This Elliott Wave corrective structure results on a reversal to take place. The token reached the equal legs area at $3.5 – $1.25 from where it ended the daily move to the downside.
The blue box showing in our chart is a technical area where we expect PENDLE to find Buyers and react higher. Up from there, it’s expected to turn to the upside either to start a new 5 waves advance or at least bounce in 3 waves from there.
Elliott Wave ZigZag Structure
PENDLE Daily Chart 9.18.2024
免責事項:本記事で述べられている見解は著者の見解のみであり、Followmeの公式見解を反映するものではありません。Followmeは、提供された情報の正確性、完全性、信頼性について一切責任を負いません。また、書面で明示的に記載されている場合を除き、本記事の内容に基づいて行われたいかなる行動についても責任を負いません。

