


· Views 154
免責事項:本記事で述べられている見解は著者の見解のみであり、Followmeの公式見解を反映するものではありません。Followmeは、提供された情報の正確性、完全性、信頼性について一切責任を負いません。また、書面で明示的に記載されている場合を除き、本記事の内容に基づいて行われたいかなる行動についても責任を負いません。
この記事が気に入ったら、著者にチップを送って感謝の気持ちを表しましょう。
| Scenario | |
|---|---|
| Timeframe | Intraday |
| Recommendation | SELL |
| Entry Point | 0.6286 |
| Take Profit | 0.6183 |
| Stop Loss | 0.6334 |
| Key Levels | 0.6183, 0.6334, 0.6381, 0.6234 |
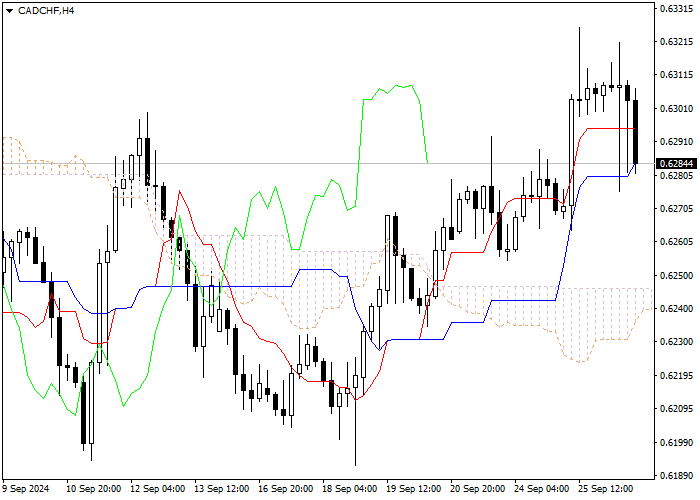
Let's look at the four-hour chart. Tenkan-sen line is above Kijun-sen, the blue line is directed upwards, while the red one remains horizontal. Confirmative line Chikou Span is below the price chart, current cloud is going to reverse from descending to ascending. The instrument is trading below Tenkan-sen and Kijun-sen lines; the Bearish trend is still strong. One of the previous minimums of Chikou Span line is expected to be a support level (0.6183). The closest resistance level is Tenkan-sen line (0.6334).
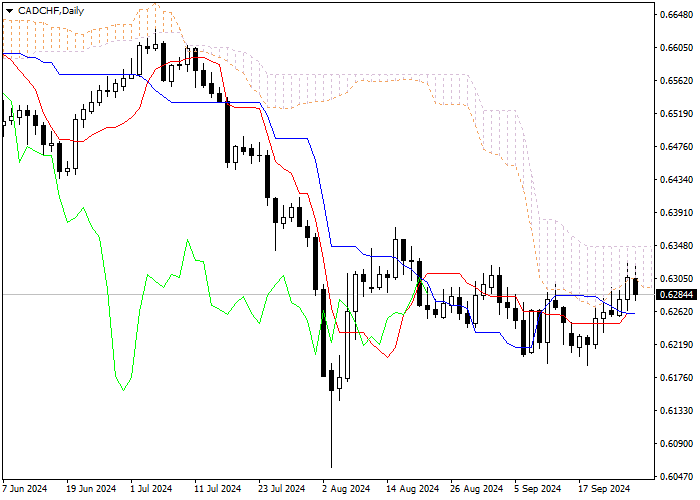
On the daily chart Tenkan-sen and Kijun-sen lines have merged, the lines are horizontal . Confirmative line Chikou Span is approaching the price chart from above, current cloud is descending. The instrument is trading above Tenkan-sen and Kijun-sen lines; the Bullish trend is still strong. One of the previous minimums of Chikou Span line is expected to be a support level (0.6381). Merged Tenkan-sen and Kijun-sen lines have become a strong resistance level (0.6234).
On the both charts the instrument is still falling. It is recommended to open short positions at current price with Take Profit at the level of previous minimum of Chikou Span line (0.6183) and Stop Loss at the level of Kijun-sen line (0.6334).
免責事項:本記事で述べられている見解は著者の見解のみであり、Followmeの公式見解を反映するものではありません。Followmeは、提供された情報の正確性、完全性、信頼性について一切責任を負いません。また、書面で明示的に記載されている場合を除き、本記事の内容に基づいて行われたいかなる行動についても責任を負いません。

