
USD/JPY: wave analysis

avatar
· Views 153


USD/JPY: wave analysis
Scenario
TimeframeWeekly
RecommendationSELL
Entry Point145.66
Take Profit131.42, 124.30
Stop Loss149.47
Key Levels124.30, 131.42, 149.47, 155.29, 162.00
Alternative scenario
RecommendationBUY STOP
Entry Point149.50
Take Profit155.29, 162.00
Stop Loss147.55
Key Levels124.30, 131.42, 149.47, 155.29, 162.00

A fall is possible.

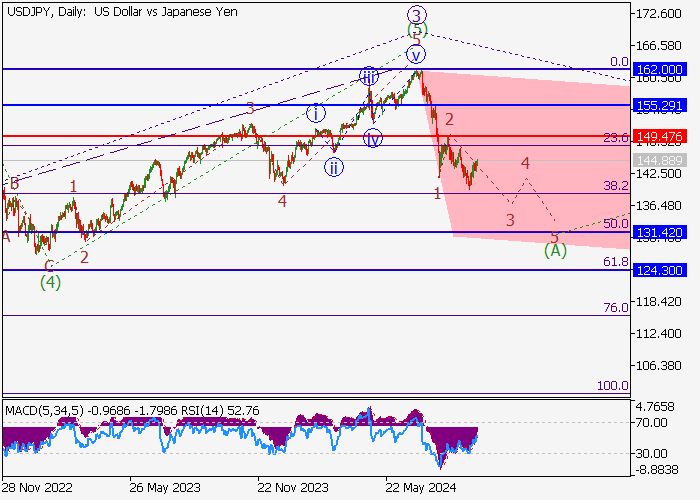
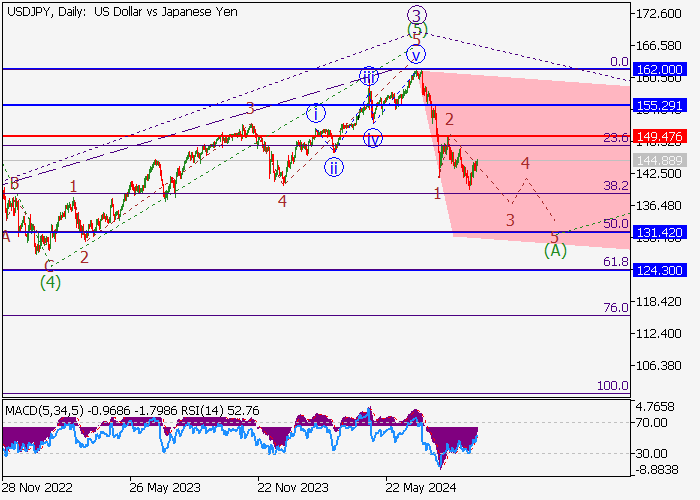
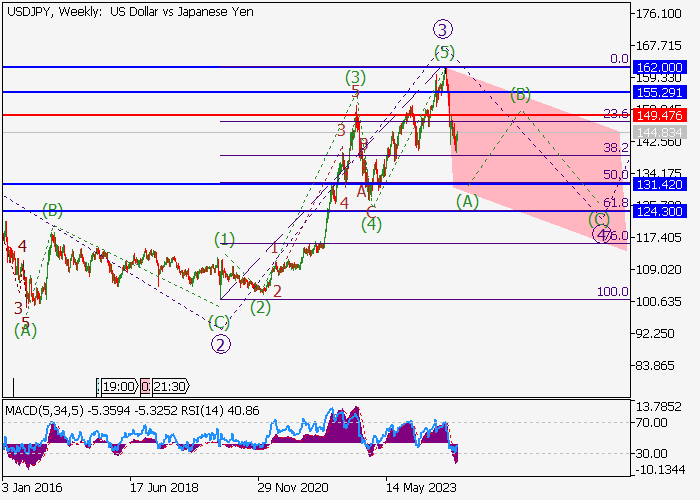
On the weekly chart, the third wave of the higher level 3 ended, within which the wave (5) of 3 ended, and a downward correction develops as the fourth wave 4. Now, the wave (A) of 4 is forming, within which the third wave of the lower level 3 of (А) is forming. If the assumption is correct, the USD/JPY pair will fall to the area of 131.42–124.30. In this scenario, critical stop loss level is 149.47.

USD/JPY: wave analysis

USD/JPY: wave analysis

Main scenario

Short positions will become relevant below the level of 149.47 with the targets at 131.42–124.30. Implementation period: 7 days and more.

Alternative scenario

A breakout and the consolidation of the price above the level of 149.47 will let the asset grow to the area of 155.29–162.00.


免責事項:本記事で述べられている見解は著者の見解のみであり、Followmeの公式見解を反映するものではありません。Followmeは、提供された情報の正確性、完全性、信頼性について一切責任を負いません。また、書面で明示的に記載されている場合を除き、本記事の内容に基づいて行われたいかなる行動についても責任を負いません。

この記事が気に入ったら、著者にチップを送って感謝の気持ちを表しましょう。
応答 0

  • tradingContest
