


| Scenario | |
|---|---|
| Timeframe | Weekly |
| Recommendation | BUY STOP |
| Entry Point | 72.20 |
| Take Profit | 76.70 |
| Stop Loss | 70.00 |
| Key Levels | 64.80, 68.90, 72.20, 76.70 |
| Alternative scenario | |
|---|---|
| Recommendation | SELL STOP |
| Entry Point | 68.90 |
| Take Profit | 64.80 |
| Stop Loss | 70.00 |
| Key Levels | 64.80, 68.90, 72.20, 76.70 |
Current trend
The price of WTI Crude Oil continues its upward dynamics, and this week, it consolidated above the key level of 70.00 amid the aggravation of the geopolitical situation in the Middle East.
Since the beginning of the summer, the American authorities have been actively increasing production, supplying oil to EU countries at a price much higher than the cost of Russian oil, which import stopped amid the sanctions policy after the start of the Russian-Ukrainian military conflict. Thus, the positive dynamics before the presidential elections do not correspond to the plans of the White House administration. It may become the reason for the appearance of an article in The Wall Street Journal about the intention of OPEC to violate the agreement on reducing production, sharply increasing it, so oil prices may fall to 50.0 dollars per barrel. The source of the information in the article was named the Minister of Energy of Saudi Arabia. However, a few hours later, the cartel issued a denial and stated that the organization did not meet last week and the content was unreliable. There is no doubt this publication was created to put pressure on the market, and after growth, the emergence of new false insiders is possible.
This week, the American Petroleum Institute (API) and the Energy Information Administration of the US Department of Energy (EIA) published reports on oil reserves. According to API, it changed from –4.339M barrels to –1.458M barrels. However, the EIA reports an increase from –4.471M barrels to 3.889M barrels, interrupting an 11-week reduction cycle.
Support and resistance
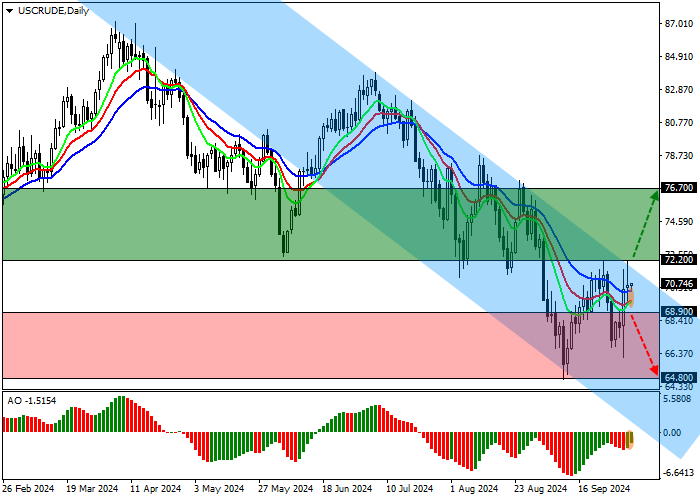
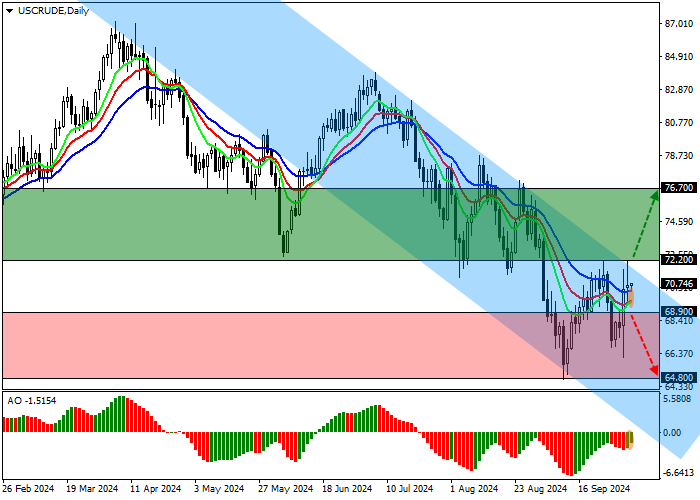
On the daily chart, the trading instrument is correcting within the wave inside the downward channel 72.50–65.00.
Technical indicators weaken the sell signal: fast EMAs on the Alligator indicator are below the signal line, actively narrowing the range of fluctuations, and the AO histogram forms correction bars, rising in the sell zone.
Resistance levels: 72.20, 76.70.
Support levels: 68.90, 64.80.
Trading tips
Long positions may be opened after the price rises and consolidates above 72.20, with the target at 76.70. Stop loss is 70.00. Implementation period: 7 days or more.
Short positions may be opened after the price falls and consolidates below 68.90, with the target at 64.80. Stop loss is 70.00.
免責事項:本記事で述べられている見解は著者の見解のみであり、Followmeの公式見解を反映するものではありません。Followmeは、提供された情報の正確性、完全性、信頼性について一切責任を負いません。また、書面で明示的に記載されている場合を除き、本記事の内容に基づいて行われたいかなる行動についても責任を負いません。

