· Views 138
免責事項:本記事で述べられている見解は著者の見解のみであり、Followmeの公式見解を反映するものではありません。Followmeは、提供された情報の正確性、完全性、信頼性について一切責任を負いません。また、書面で明示的に記載されている場合を除き、本記事の内容に基づいて行われたいかなる行動についても責任を負いません。
この記事が気に入ったら、著者にチップを送って感謝の気持ちを表しましょう。
| Scenario | |
|---|---|
| Timeframe | Weekly |
| Recommendation | BUY STOP |
| Entry Point | 68.80 |
| Take Profit | 71.88, 75.00 |
| Stop Loss | 66.25 |
| Key Levels | 53.12, 56.25, 62.50, 68.75, 71.88, 75.00 |
| Alternative scenario | |
|---|---|
| Recommendation | SELL STOP |
| Entry Point | 62.45 |
| Take Profit | 56.25, 53.12 |
| Stop Loss | 65.10 |
| Key Levels | 53.12, 56.25, 62.50, 68.75, 71.88, 75.00 |
Current trend
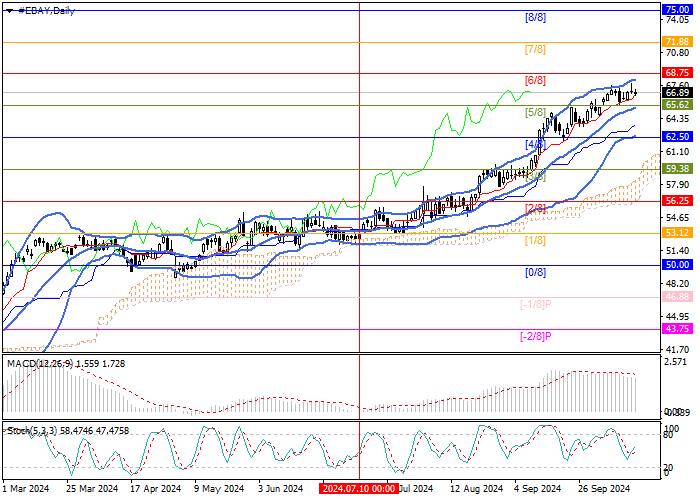
Shares of eBay Inc., an American online retail company, are rising within a long-term upward trend. The price grew to the reversal mark of 68.75 (Murrey level [6/8]). The consolidation above will allow it to reach the area of 71.88 (Murrey level [7/8]) and 75.00 (Murrey level [8/8]). In case of a breakout of the central mark of the Murrey trading range 62.50 (Murrey level [4/8]), supported by the lower line of Bollinger Bands, a decrease in the quotes to the area of 56.25 (Murrey level [2/8]) and 53.12 (Murrey level [1/8]) may follow.
Technical indicators confirm the continuation of the upward trend: Bollinger Bands and Stochastic are reversing upwards, and the MACD histogram is falling in the negative zone.
Support and resistance
Resistance levels: 68.75, 71.88, 75.00.
Support levels: 62.50, 56.25, 53.12.

Trading tips
Long positions may be opened above 68.75, with the targets at 71.88, 75.00, and stop loss 66.25. Implementation period: 5–7 days.
Short positions may be opened below 62.50, with the targets at 56.25, 53.12, and stop loss 65.10.
免責事項:本記事で述べられている見解は著者の見解のみであり、Followmeの公式見解を反映するものではありません。Followmeは、提供された情報の正確性、完全性、信頼性について一切責任を負いません。また、書面で明示的に記載されている場合を除き、本記事の内容に基づいて行われたいかなる行動についても責任を負いません。

古いコメントはありません。ソファをつかむ最初のものになりましょう。