· Views 134
免責事項:本記事で述べられている見解は著者の見解のみであり、Followmeの公式見解を反映するものではありません。Followmeは、提供された情報の正確性、完全性、信頼性について一切責任を負いません。また、書面で明示的に記載されている場合を除き、本記事の内容に基づいて行われたいかなる行動についても責任を負いません。
この記事が気に入ったら、著者にチップを送って感謝の気持ちを表しましょう。
| Scenario | |
|---|---|
| Timeframe | Weekly |
| Recommendation | BUY STOP |
| Entry Point | 196.05 |
| Take Profit | 213.00 |
| Stop Loss | 192.00 |
| Key Levels | 169.00, 189.00, 196.05, 213.00 |
| Alternative scenario | |
|---|---|
| Recommendation | SELL STOP |
| Entry Point | 188.95 |
| Take Profit | 169.00 |
| Stop Loss | 194.00 |
| Key Levels | 169.00, 189.00, 196.05, 213.00 |
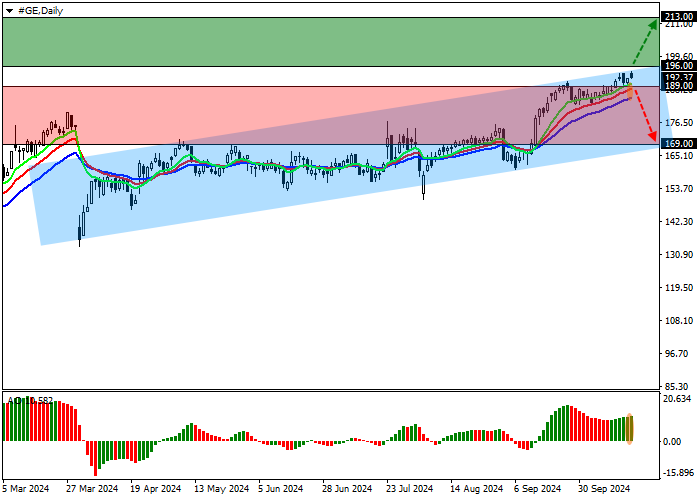
General Electric Co., an American diversified corporation, trades within the strengthening correction at 192.00.
On the daily chart, the price is forming an ascending channel with dynamic boundaries of 196.00–168.00.
On the four-hour chart, the quotes are moving towards the resistance line of 196.00 and may consolidate above the year’s high of 193.00 this week. However, if the asset consolidates below the high of 190.00 from September 25, the probability of a decline will increase.
Technical indicators are strengthening the buy signal: fast EMAs on the Alligator indicator are above the signal line, expanding the range, and the AO histogram is forming correction bars above the transition level.

Trading tips
Long positions may be opened after the price grows and consolidates above 196.00, with the target at 213.00. Stop loss — 192.00. Implementation period: 7 days or more.
Short positions may be opened after the price declines and consolidates below 189.00, with the target at 169.00. Stop loss — 194.00.
免責事項:本記事で述べられている見解は著者の見解のみであり、Followmeの公式見解を反映するものではありません。Followmeは、提供された情報の正確性、完全性、信頼性について一切責任を負いません。また、書面で明示的に記載されている場合を除き、本記事の内容に基づいて行われたいかなる行動についても責任を負いません。

古いコメントはありません。ソファをつかむ最初のものになりましょう。