
| Scenario | |
|---|---|
| Timeframe | Intraday |
| Recommendation | SELL STOP |
| Entry Point | 0.8640 |
| Take Profit | 0.8600 |
| Stop Loss | 0.8669 |
| Key Levels | 0.8541, 0.8570, 0.8600, 0.8641, 0.8669, 0.8700, 0.8730, 0.8776 |
| Alternative scenario | |
|---|---|
| Recommendation | BUY STOP |
| Entry Point | 0.8670 |
| Take Profit | 0.8730 |
| Stop Loss | 0.8641 |
| Key Levels | 0.8541, 0.8570, 0.8600, 0.8641, 0.8669, 0.8700, 0.8730, 0.8776 |
Current trend
During the morning session, the USD/CHF pair is consolidating near the highs of August 16 at 0.8660 as traders await the publication of US business activity statistics for October from S&P Global at 15:45 (GMT 2).
Thus, the manufacturing PMI may increase from 47.3 points to 47.5 points, while the service PMI may decrease from 55.2 points to 55.0 points. Meanwhile, investors are assessing the dynamics of existing home sales, which changed from –2.0% to –1.0%, and the monthly economic review from the US Fed Beige Book, which reflected either the preservation or a moderate decline in economic activity in the regions. Most counties reported a slowdown in manufacturing, while the banking sector remained stable or strengthened. The real estate sector is unchanged, although the shortage of affordable housing in many cities remains a serious problem.
There were no important statistics for investors in Switzerland this week, and traders are awaiting the October EU business activity data at 10:00 (GMT 2) today. According to preliminary estimates, the manufacturing PMI will be adjusted from 45.0 points to 45.1 points, the service PMI from 51.4 points to 51.6 points, and the composite PMI from 49.6 points to 49.7 points.
Support and resistance
On the daily chart, Bollinger bands are growing moderately: the price range is narrowing, reflecting the emergence of ambiguous trading dynamics in the ultra-short term. The MACD indicator is slightly decreasing, trying to form a new sell signal (the histogram is attempting to settle below the signal line). Stochastic is retreating from the highs, signaling the development of a full-fledged downtrend in the ultra-short term.
Resistance levels: 0.8669, 0.8700, 0.8730, 0.8776.
Support levels: 0.8641, 0.8600, 0.8570, 0.8541.
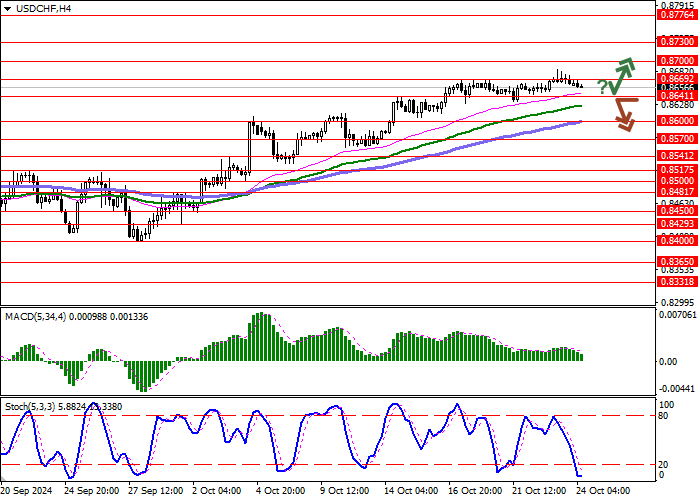

Trading tips
Short positions may be opened after a breakdown of the 0.8641 level, with the target at 0.8600. Stop loss — 0.8669. Implementation period: 1–2 days.
Long positions may be opened after a rebound from the 0.8641 level and a breakout of the 0.8669 level, with the target at 0.8730. Stop loss — 0.8641.
免責事項:本記事で述べられている見解は著者の見解のみであり、Followmeの公式見解を反映するものではありません。Followmeは、提供された情報の正確性、完全性、信頼性について一切責任を負いません。また、書面で明示的に記載されている場合を除き、本記事の内容に基づいて行われたいかなる行動についても責任を負いません。

古いコメントはありません。ソファをつかむ最初のものになりましょう。