Hello fellow traders. In this technical article we’re going to take a look at the Elliott Wave charts charts of NASDAQ Futures (NQ_F) published in members area of the website. Our members know NQ_F is showing impulsive bullish sequences and we are favoring the long side. In this discussion, we’ll break down the Elliott Wave pattern and forecast.
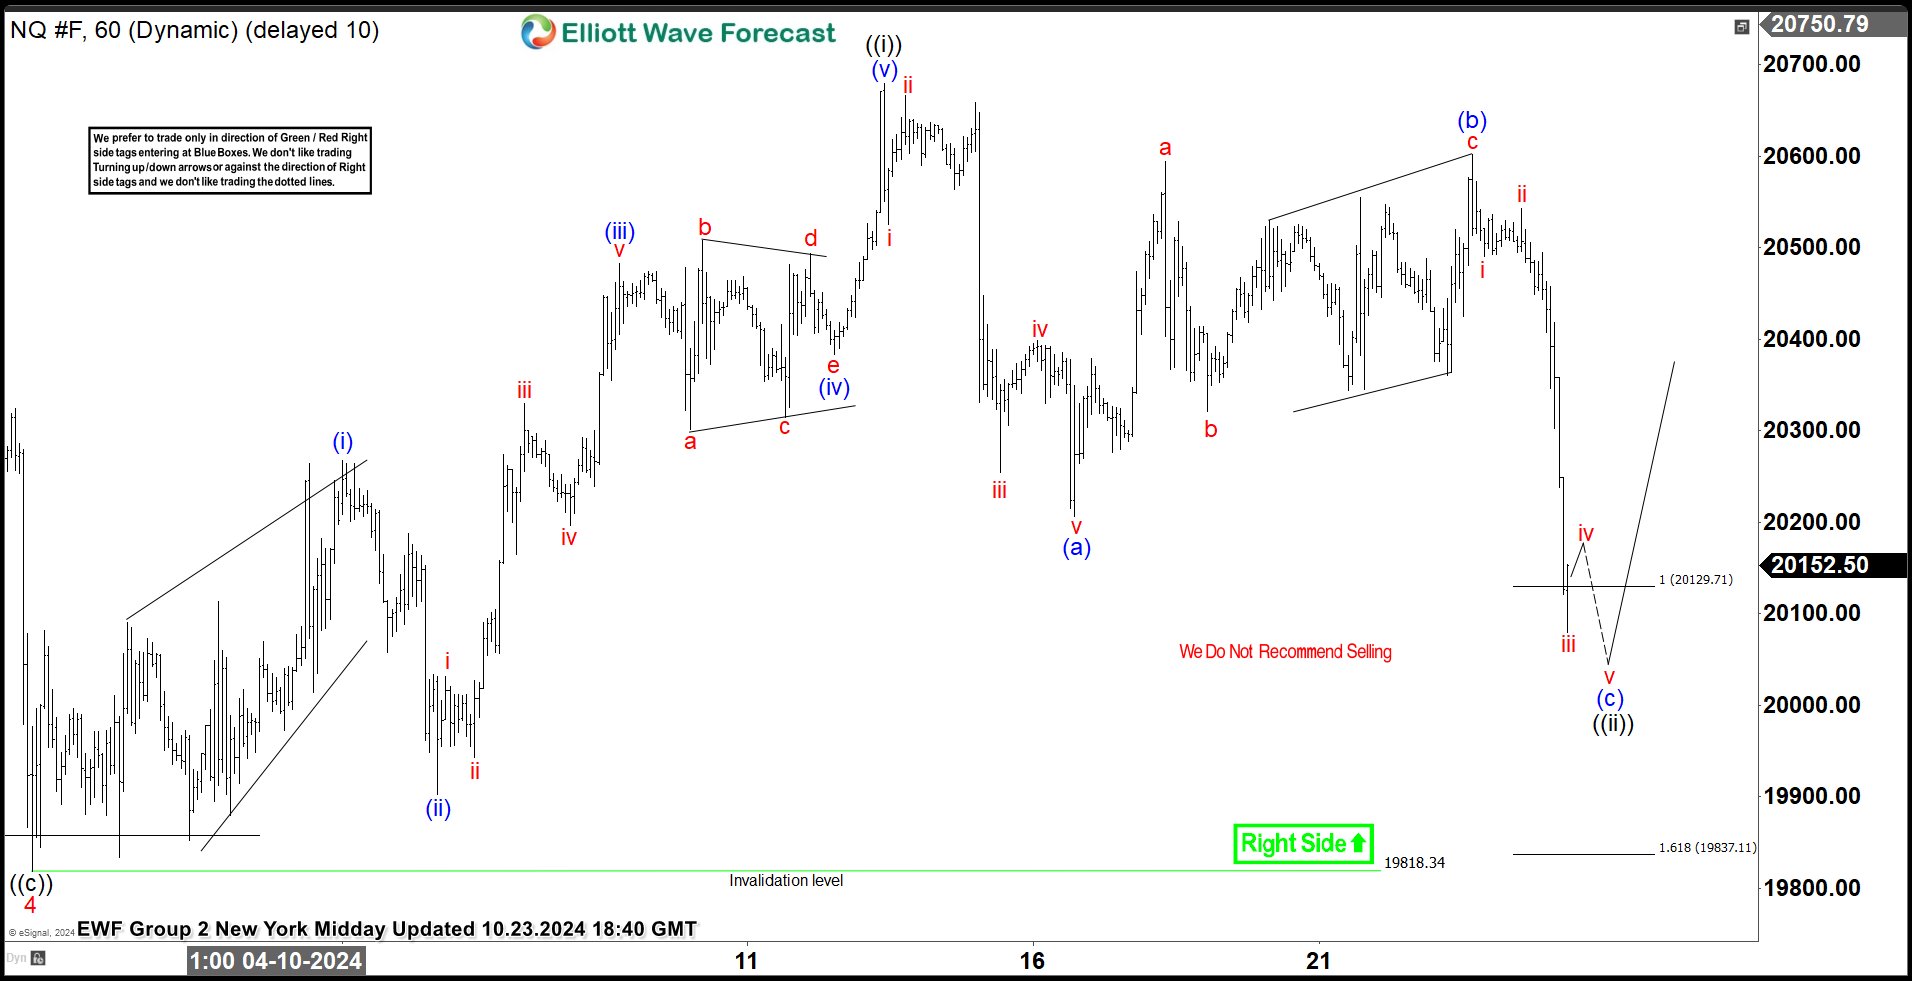
NASDAQ Elliott Wave 1 Hour Chart 10.23.2024
NASDAQ is giving us wave ((ii)) black correction. The futures has reached extreme zone from the peak at 20129- 19837 area. NQ_F shows clear 3 waves from the high, suggesting pull back could be ending any moment. Consequently , we expect rally in wave ((iii)) to happen any moment. We recommend members to avoid selling the futures and keep favoring the long side. As the main trend is bullish we expect to see rally toward new highs ideally or 3 waves bounce from the equal legs alternatively.
Official trading strategy on How to trade 3, 7, or 11 swing and equal leg is explained in details in Educational Video, available for members viewing inside the membership area.
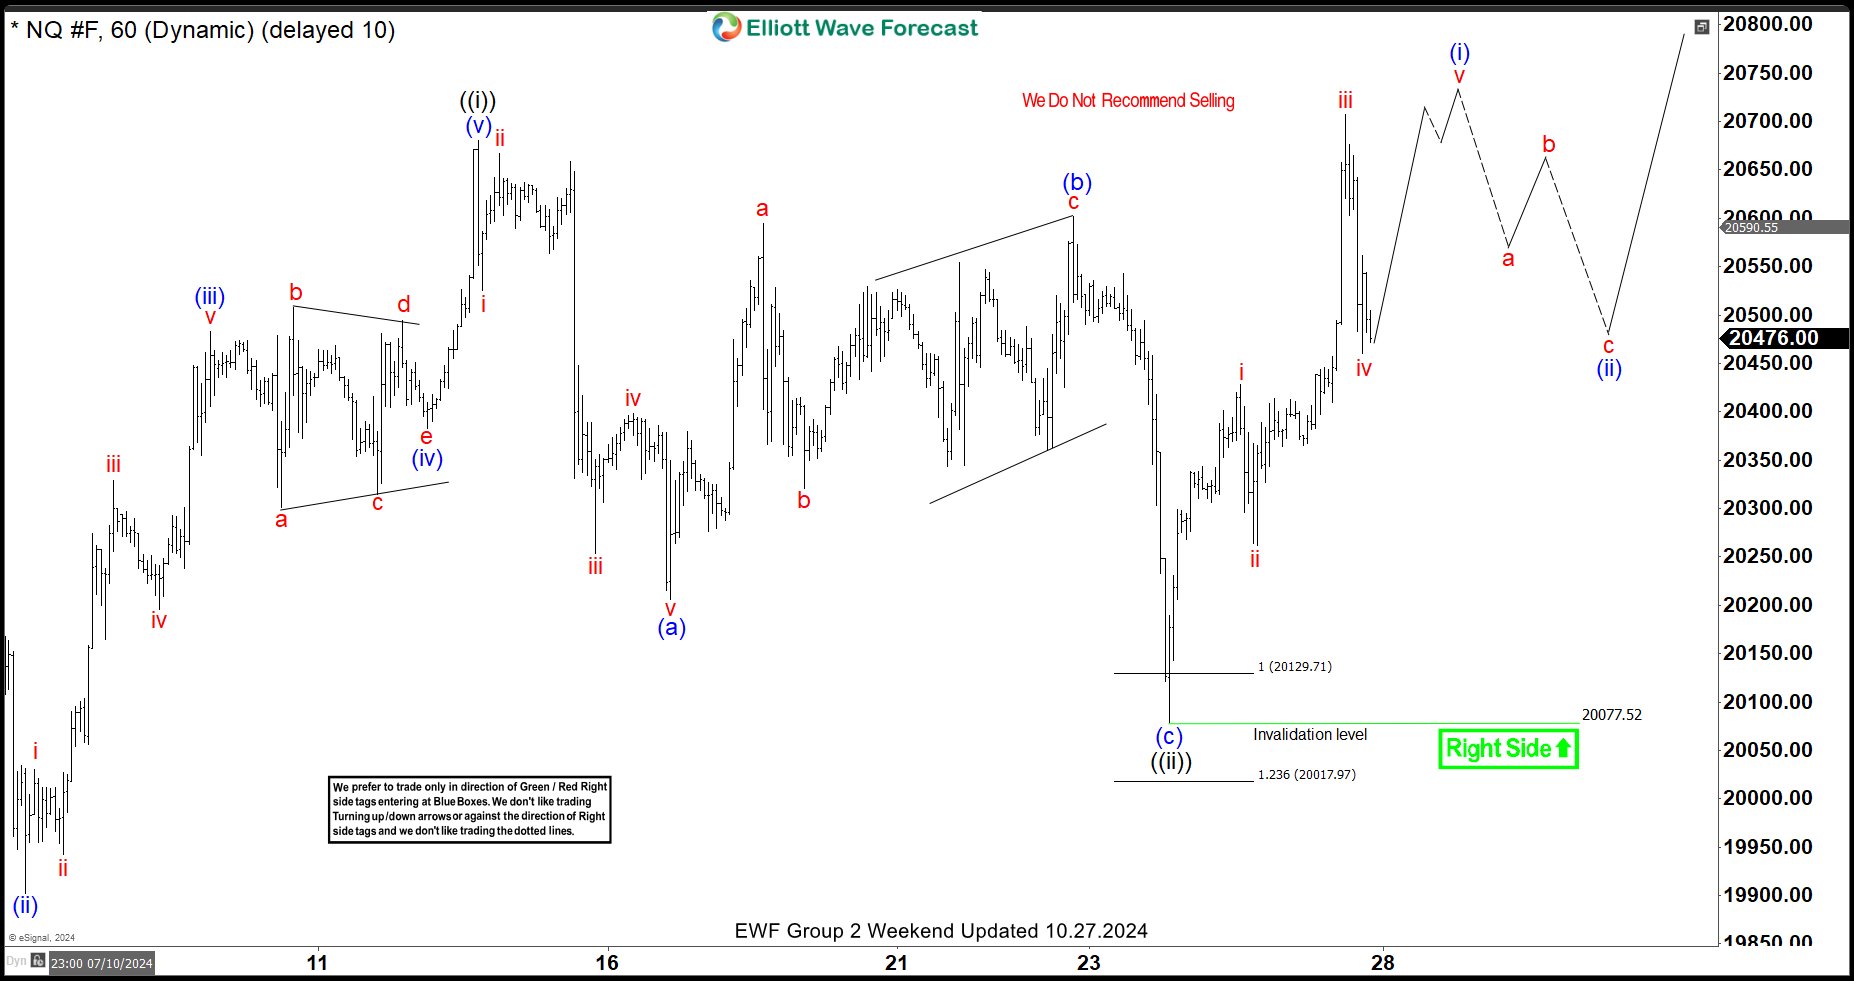
NASDAQ Elliott Wave 1 Hour Chart 10.23.2024
NASDAQ responded exactly as anticipated at the equal legs. The futures found buyers and made a substantial rally from our recommended buying zone. Eventually we got break of ((i)) black peak , confirming next leg up is in progress. The futures should ideally keep finding buyers in 3,7,11 swings sequences against the 20077.5 pivot.
Keep in mind that market is dynamic and presented view could have changed in the mean time. You can check most recent charts in the membership area of the site. Best instruments to trade are those having incomplete bullish or bearish swings sequences. We put them in Sequence Report and best among them are shown in the Live Trading Room
免責事項:本記事で述べられている見解は著者の見解のみであり、Followmeの公式見解を反映するものではありません。Followmeは、提供された情報の正確性、完全性、信頼性について一切責任を負いません。また、書面で明示的に記載されている場合を除き、本記事の内容に基づいて行われたいかなる行動についても責任を負いません。

古いコメントはありません。ソファをつかむ最初のものになりましょう。