



| Scenario | |
|---|---|
| Timeframe | Weekly |
| Recommendations | BUY STOP |
| Entry point | 100.05 |
| Take Profit | 103.12 |
| Stop Loss | 97.60 |
| Key levels | 90.62, 93.75, 96.88, 100.00, 101.56, 103.12 |
| Alternative scenario | |
|---|---|
| Recommendations | SELL STOP |
| Entry point | 96.85 |
| Take Profit | 93.75, 90.62 |
| Stop Loss | 98.90 |
| Key levels | 90.62, 93.75, 96.88, 100.00, 101.56, 103.12 |
Current dynamics
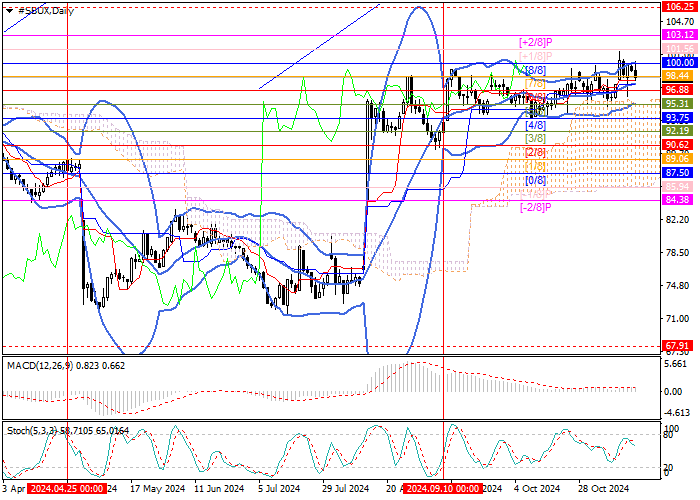
Shares of Starbucks Corp., one of the largest companies that owns the coffee shop chain of the same name, have been trading in a sideways range of 93.75–100.00 (Murray level [4/8]–[8/8]) for the third month and have not been able to leave it yet: the price is currently testing the upper boundary of the channel and if it consolidates above it, it will continue to grow in the upper reversal zone to 103.12 (Murray level [ 2/8]). If the asset consolidates below the middle line of Bollinger Bands 96.88 (Murray level [6/8]), a decline to the area of 93.75 (Murray level [4/8]) and 90.62 (Murray level [2/8]) is expected.
Technical indicators do not give a single signal: Bollinger bands are turning up, the MACD histogram is stable in the positive zone, but Stochastic is turning down. It is worth considering that the long-term upward trend in the market remains, which increases the likelihood of renewed growth in quotes.
Support and resistance levels
Resistance levels: 100.00, 101.56, 103.12.
Support levels: 96.88, 93.75, 90.62.
Trading scenarios
Long positions can be opened above the level of 100.00 with a target of 103.12 and a stop-loss of 97.60. Implementation period: 5-7 days.
Short positions can be opened below the level of 96.88 with targets at 93.75, 90.62 and stop-loss at 98.90.
免責事項:本記事で述べられている見解は著者の見解のみであり、Followmeの公式見解を反映するものではありません。Followmeは、提供された情報の正確性、完全性、信頼性について一切責任を負いません。また、書面で明示的に記載されている場合を除き、本記事の内容に基づいて行われたいかなる行動についても責任を負いません。

