


· Views 600
Japanese candlesticks are highly regarded for the wealth of information they offer. Each candlestick reveals:
- The direction of price movement,
- The opening and closing prices during the selected time frame,
- The highest and lowest prices reached during this period.
By analyzing how candlesticks relate to one another, traders can identify trends. Here are a few examples in one image:
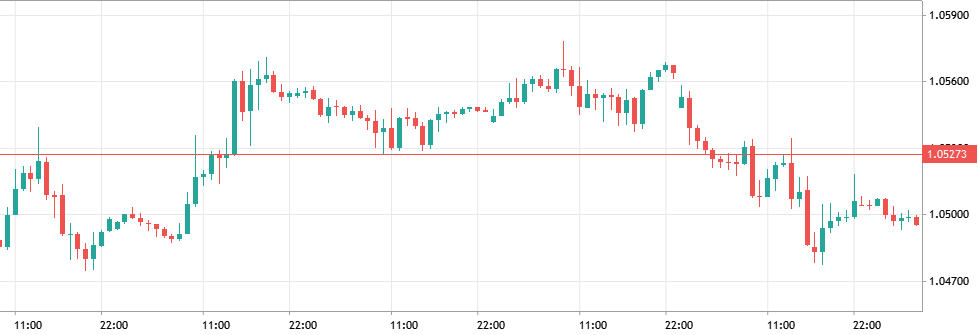
While spotting a trend is relatively simple, recognizing its beginning is more challenging. Fortunately, several candlestick patterns help predict reversals or new trends.
免責事項:本記事で述べられている見解は著者の見解のみであり、Followmeの公式見解を反映するものではありません。Followmeは、提供された情報の正確性、完全性、信頼性について一切責任を負いません。また、書面で明示的に記載されている場合を除き、本記事の内容に基づいて行われたいかなる行動についても責任を負いません。
この記事が気に入ったら、著者にチップを送って感謝の気持ちを表しましょう。

