


The Global X Uranium ETF (URA) is designed to provide investors with exposure to the uranium mining industry. It includes companies involved in uranium mining, exploration, development, and production, as well as those producing nuclear components. With significant holdings in major uranium producers like Cameco, URA offers a way to invest in the nuclear energy sector's growth amid increasing global demand for clean energy solutions.
$URA Elliott Wave Chart Monthly Chart
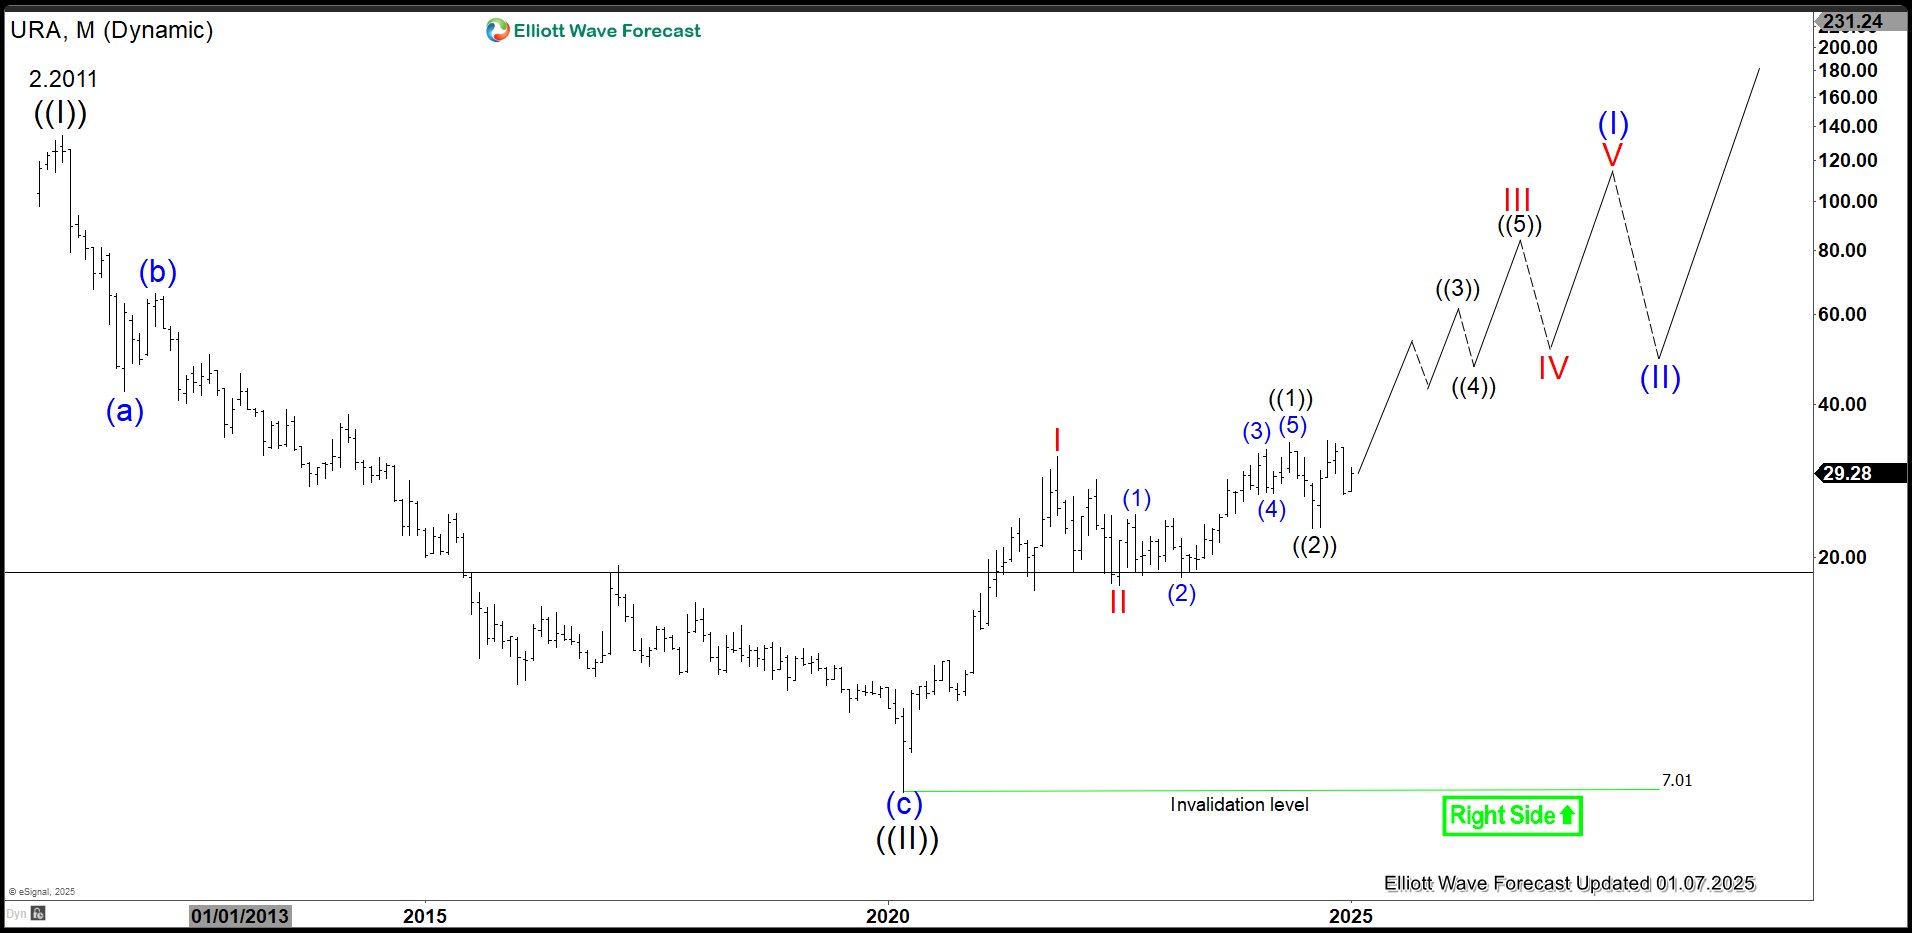
Uranium ETF (URA) Monthly Chart above shows the ETF ended wave ((II)) at 7.01. Up from there, the instrument is nesting higher as an impulse. Wave I ended at 31.6 and dips in wave II ended at 17.65. It resumed higher in wave ((1)) towards 33.66 and pullback in wave ((2)) ended at 22.79. Expect the instrument to extend higher in wave ((3)) of III as far as pivot at 7.01 low stays intact.
$URA Daily Elliott Wave Chart
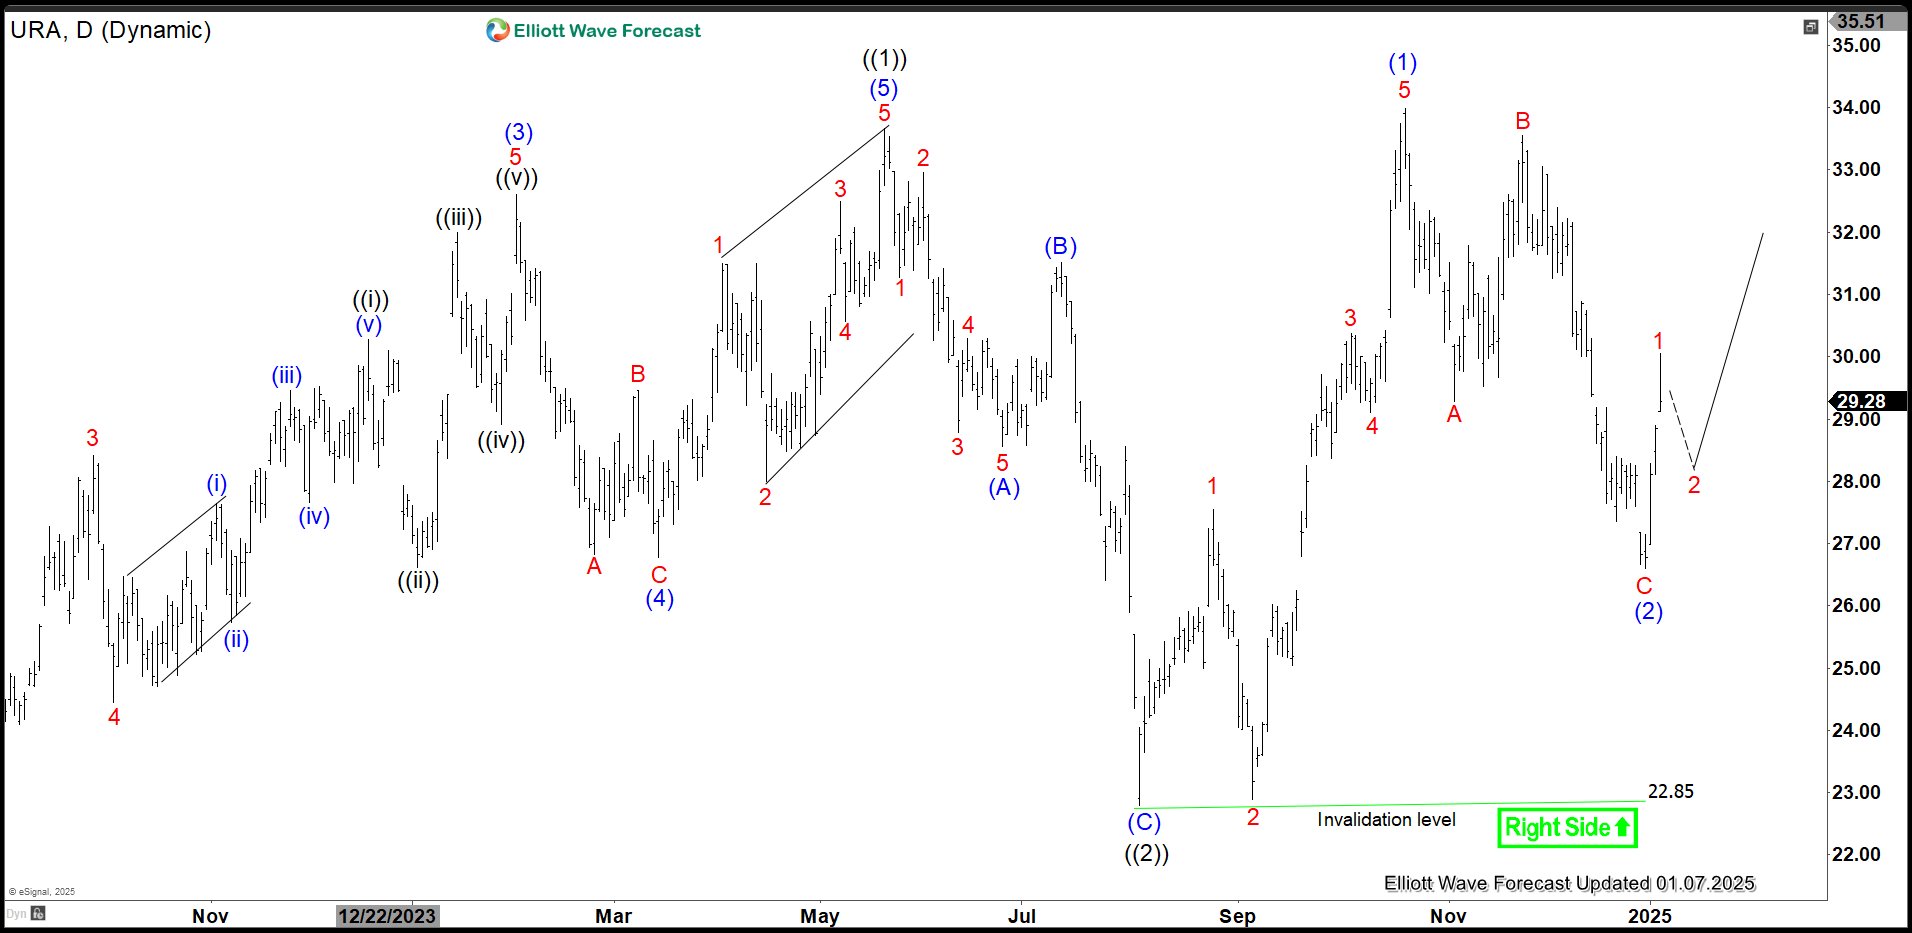 Daily chart above shows that the ETF ended wave ((1)) at 33.66. Pullback in wave ((2)) ended at 22.85 as a zigzag. The instrument has turned higher again wave ((3)). Up from wave ((2)), wave 1 ended at 27.55 and wave 2 pullback ended at 22.89. Wave 3 higher ended at 30.37, pullback in wave 4 ended at 29.11, and final wave 5 higher ended at 33.75. This completed wave (1) in higher degree. Wave (2) pullback unfolded as a zigzag where wave A ended at 29.27 and wave B ended at 33.56. Wave C lower ended at 26.6 which completed wave (2). The ETF has turned higher in wave (3). Up from wave (2), wave 1 ended at 30.05. Near term, as far as pivot at 22.85 low stays intact, expect pullback to find support in 3, 7, 11 swing for more upside.
免責事項:本記事で述べられている見解は著者の見解のみであり、Followmeの公式見解を反映するものではありません。Followmeは、提供された情報の正確性、完全性、信頼性について一切責任を負いません。また、書面で明示的に記載されている場合を除き、本記事の内容に基づいて行われたいかなる行動についても責任を負いません。

