


Hello everyone! In today’s article, we’ll examine the recent performance of Netflix Inc. ($NFLX) through the lens of Elliott Wave Theory. We’ll review how the decline from the June 30, 2025, high unfolded as a 7-swing correction (WXY) and discuss our forecast for the next move. Let’s dive into the structure and expectations for this stock.
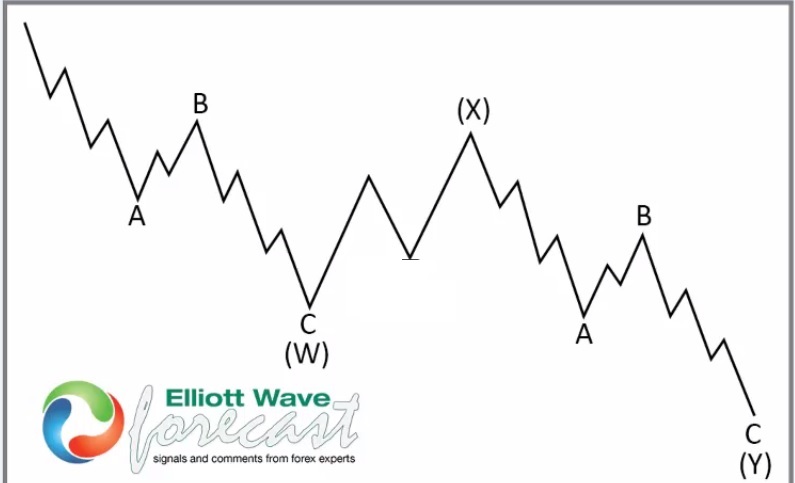
7 Swing WXY correction
$NFLX 4H Elliott Wave Chart 7.20.2025:
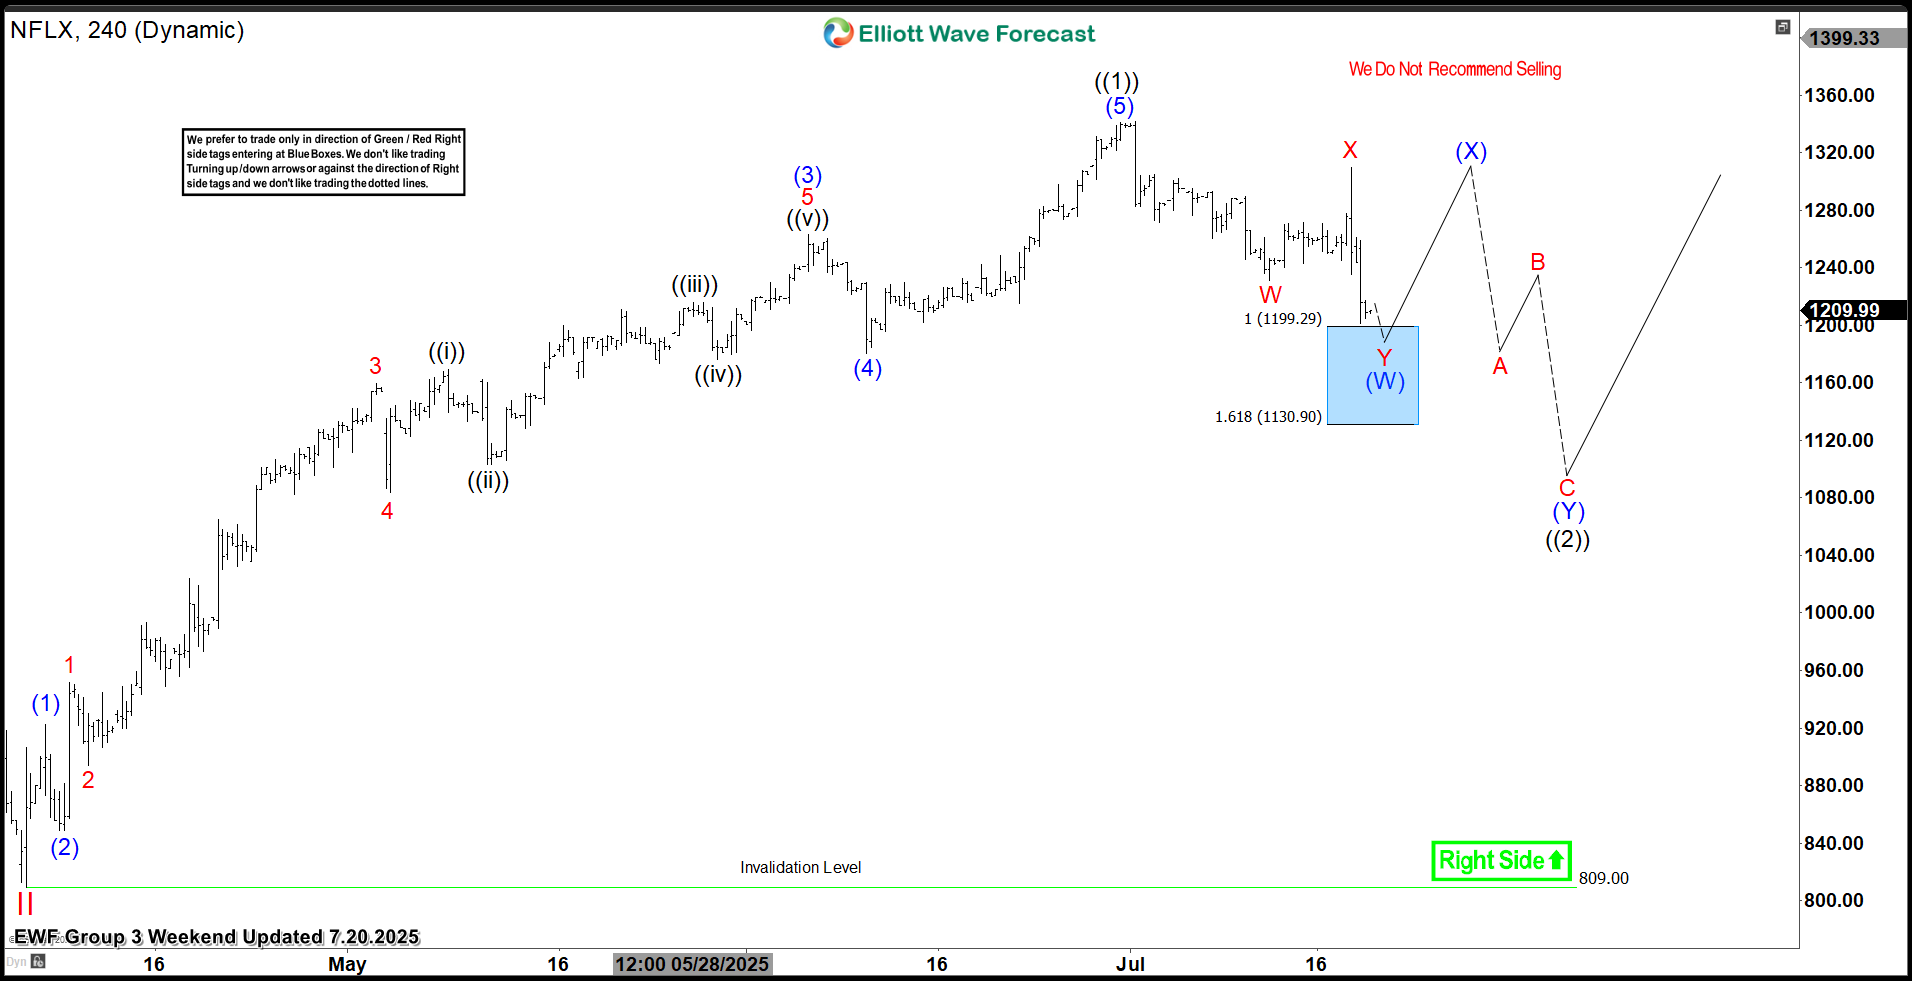 In the 4H Elliott Wave count from July 20, 2025, we saw that $NFLX completed a 5-wave impulsive cycle at black ((1)). As expected, this initial wave prompted a pullback. We anticipated this pullback to unfold in 7 swings, likely finding buyers in the equal legs area between $1199.29 and $1130.90.
This setup aligns with a typical Elliott Wave correction pattern (WXY), in which the market pauses briefly before resuming its primary trend.
$NFLX 4H Elliott Wave Chart 7.27.2025:
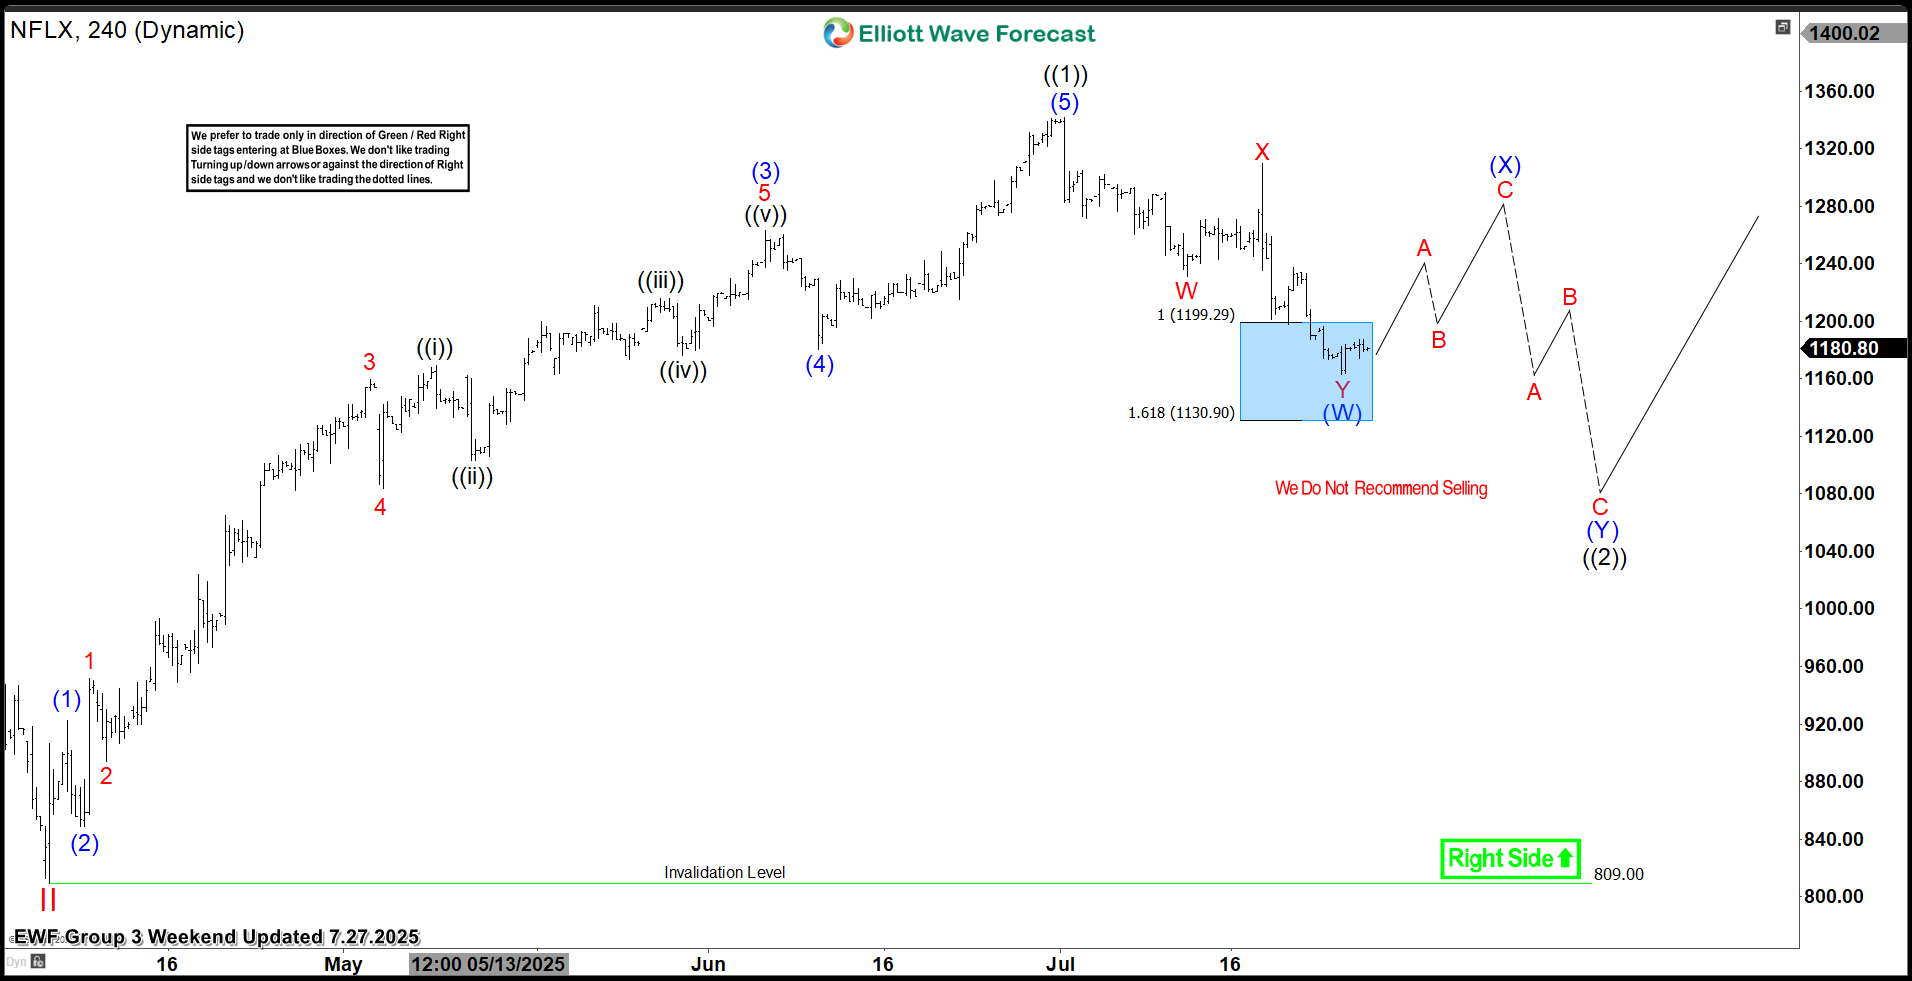 The most recent update, from July 27, 2025, shows that the stock has found a low as predicted. After the decline from the June peak, the stock is now finding support from the equal legs area. Currently, it is looking for a corrective bounce towards 1240 - 1280. After that, the stock is expected to continue lower in wave ((2)) before a renewed bullish cycle takes place.
Conclusion
In conclusion, our Elliott Wave analysis of Netflix Inc. ($NFLX) suggests that it remains supported against April 2025 lows. As a result, traders should buy the dips and monitor the $1240–$1280 zone as the next potential target. In the meantime, keep an eye out for any corrective pullbacks that may offer entry opportunities. By applying Elliott Wave Theory, traders can better anticipate the structure of upcoming moves and enhance risk management in volatile markets.
免責事項:本記事で述べられている見解は著者の見解のみであり、Followmeの公式見解を反映するものではありません。Followmeは、提供された情報の正確性、完全性、信頼性について一切責任を負いません。また、書面で明示的に記載されている場合を除き、本記事の内容に基づいて行われたいかなる行動についても責任を負いません。

