Hershey (NYSE: HSY) shows a bullish Elliott Wave structure indicating that the correction may have ended, and a new upward cycle could soon resume.
The Hershey Company (NYSE: HSY) is showing early signs of strength after months of decline. Based on Elliott Wave Theory, the long-term chart suggests that the correction may have ended and a new uptrend could start soon.
From the early 2000s, HSY moved higher in a clear five-wave advance. This strong rally finished at the 2023 peak near $275, marking the end of wave (I). After that, the price pulled back in a W-X-Y corrective pattern. This decline formed wave (II), which helped the market reset before the next possible rally. The correction stayed well above the invalidation level at $29.78, keeping the long-term bullish view valid.
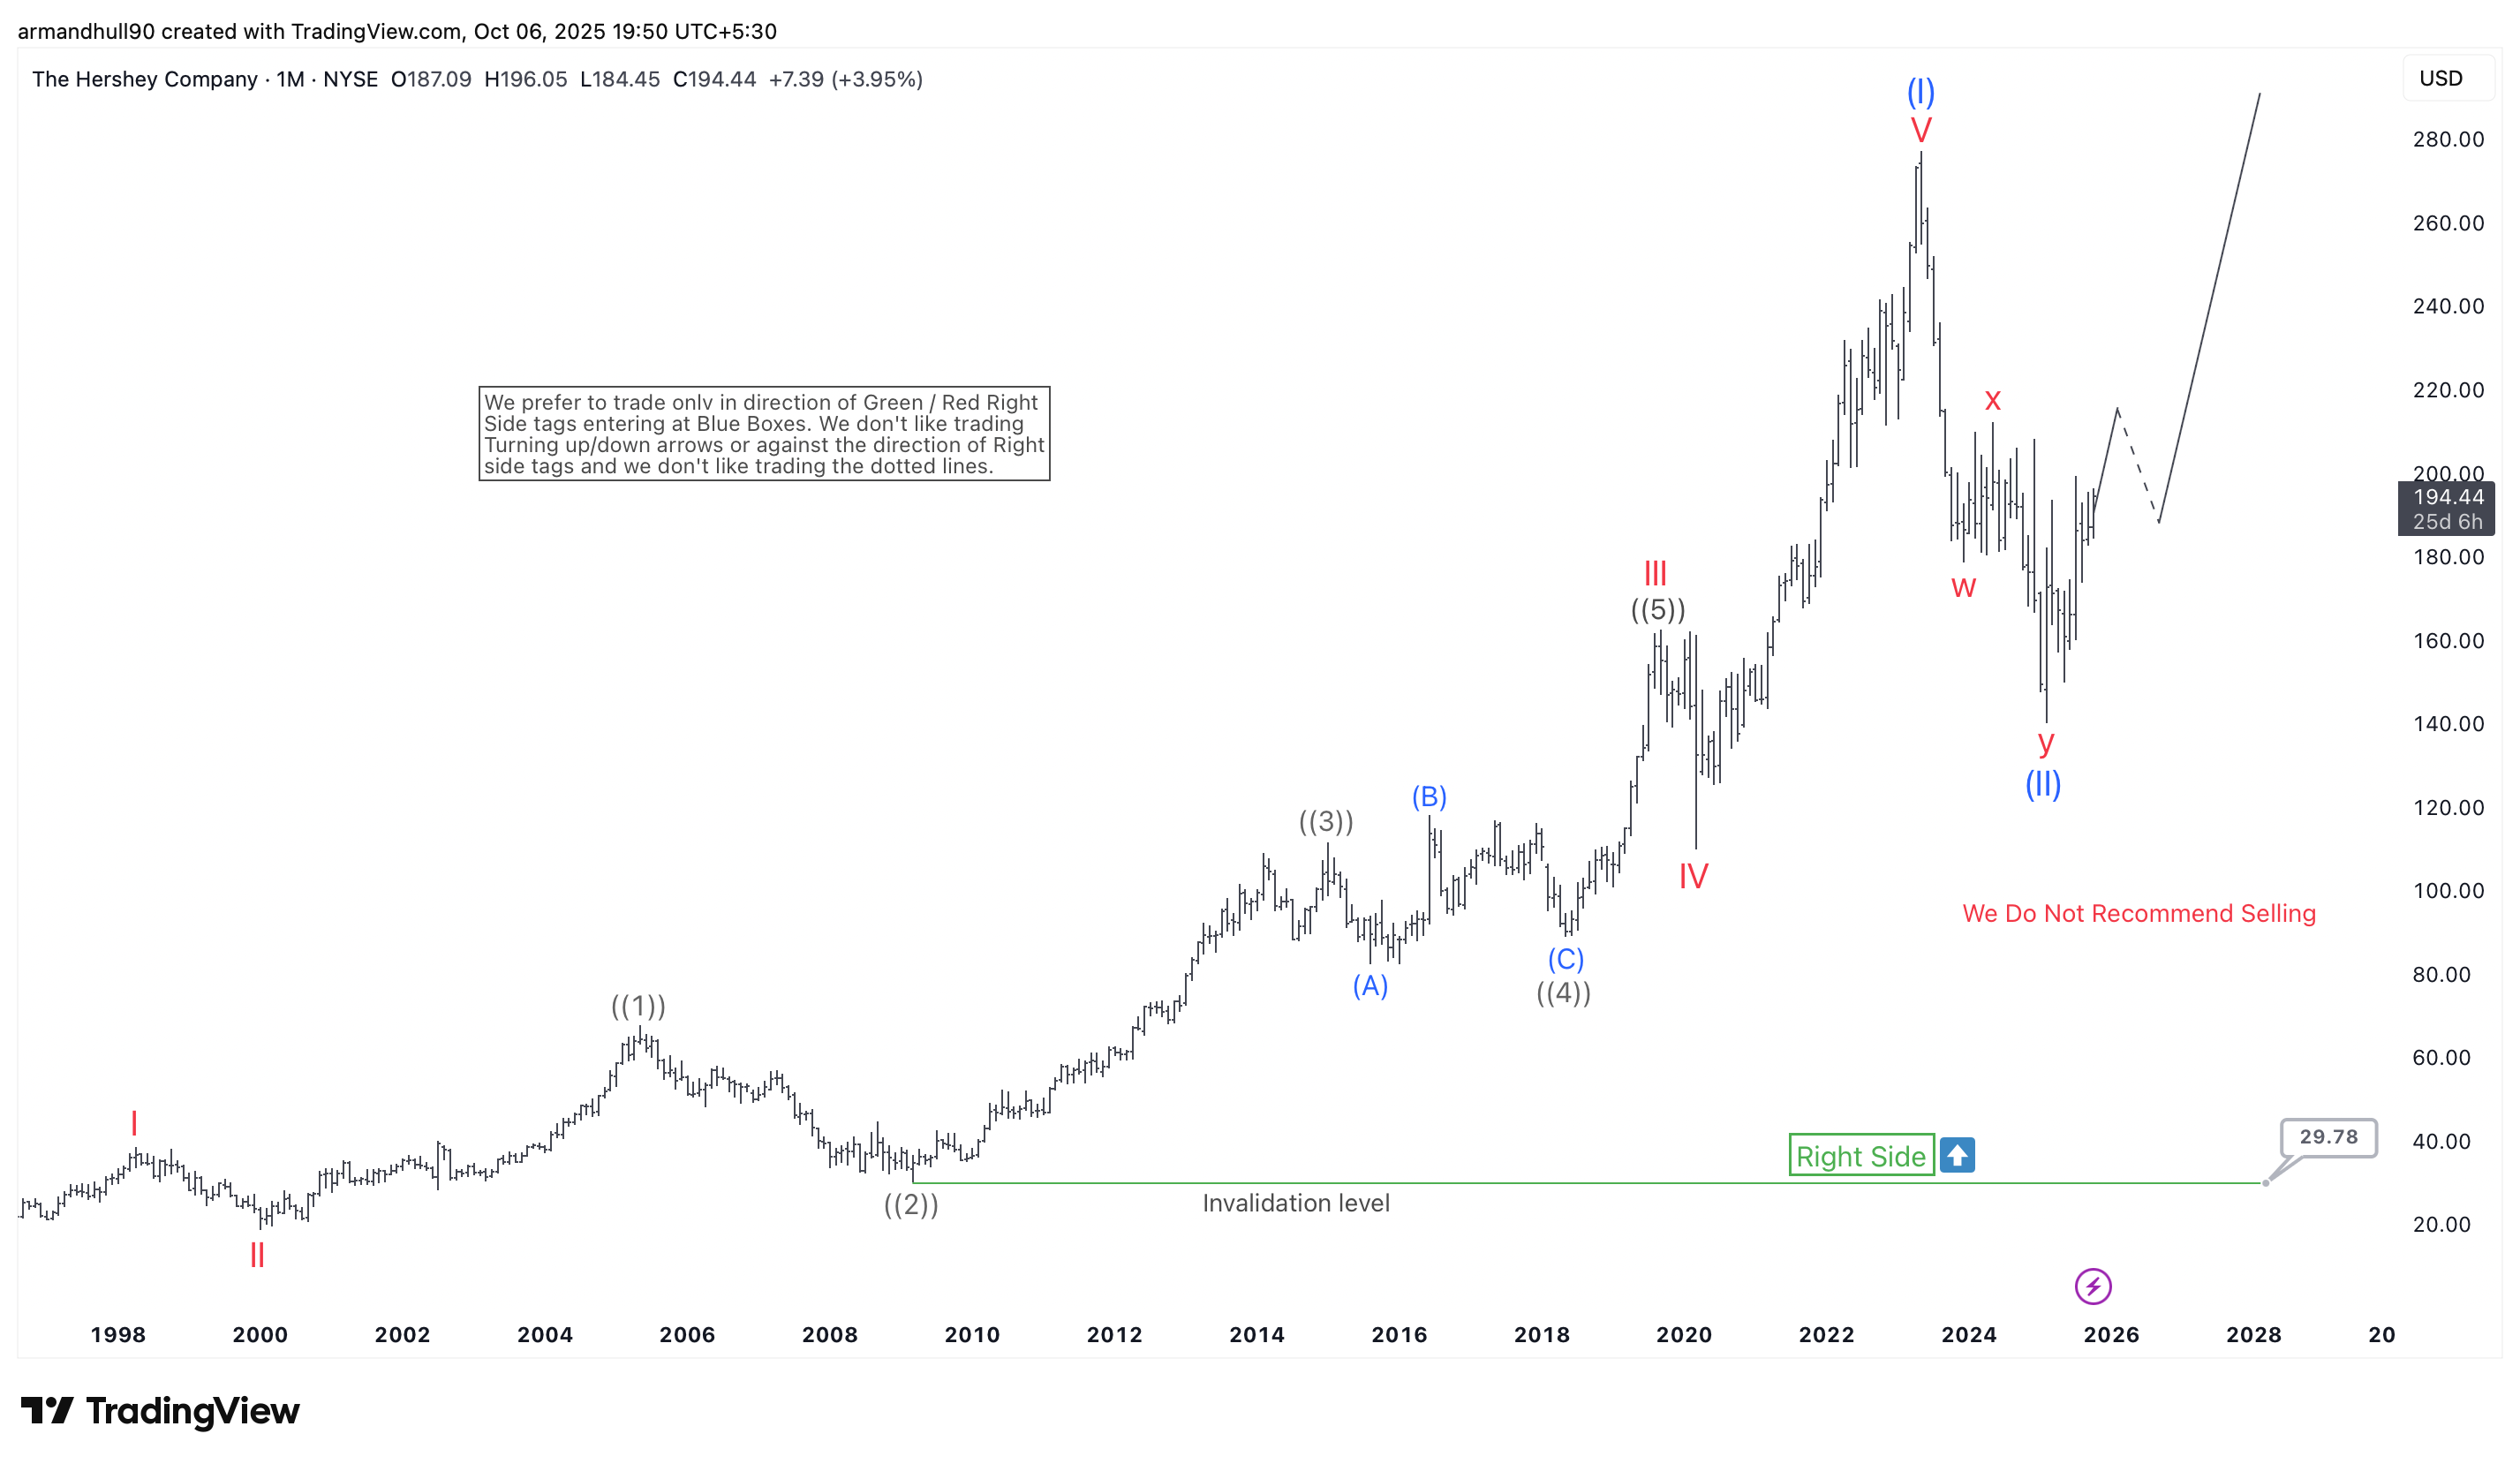
Now, the stock trades near $190–200, where it is showing early support. The Elliott Wave forecast expects prices to rise from this zone and move toward new highs in the next few years. Analysts note, “We do not recommend selling,” which highlights the positive bias for HSY. As long as the price holds above key support, the bullish trend should remain in play.
Summary:
In summary, Hershey’s chart suggests that the market has completed its correction phase. Therefore, investors can watch for confirmation of a new impulsive rally. The area near the recent lows offers an attractive long-term buying zone, especially for those who trade in the direction of the main trend.
免責事項:本記事で述べられている見解は著者の見解のみであり、Followmeの公式見解を反映するものではありません。Followmeは、提供された情報の正確性、完全性、信頼性について一切責任を負いません。また、書面で明示的に記載されている場合を除き、本記事の内容に基づいて行われたいかなる行動についても責任を負いません。

古いコメントはありません。ソファをつかむ最初のものになりましょう。