


AppLovin Corporation (NASDAQ: APP) operates a leading marketing platform that fuels mobile app growth through advanced AI and machine learning. The company has demonstrated exceptional performance, with its stock breaking decisively into new high territory and confirming a powerful bullish trend.
Today, we analyze the Elliott Wave structure behind this impressive breakout. Our technical blueprint outlines precise pathways and upside targets for the next leg of this rally, highlighting a compelling opportunity driven by strong technical momentum.
Elliott Wave Analysis
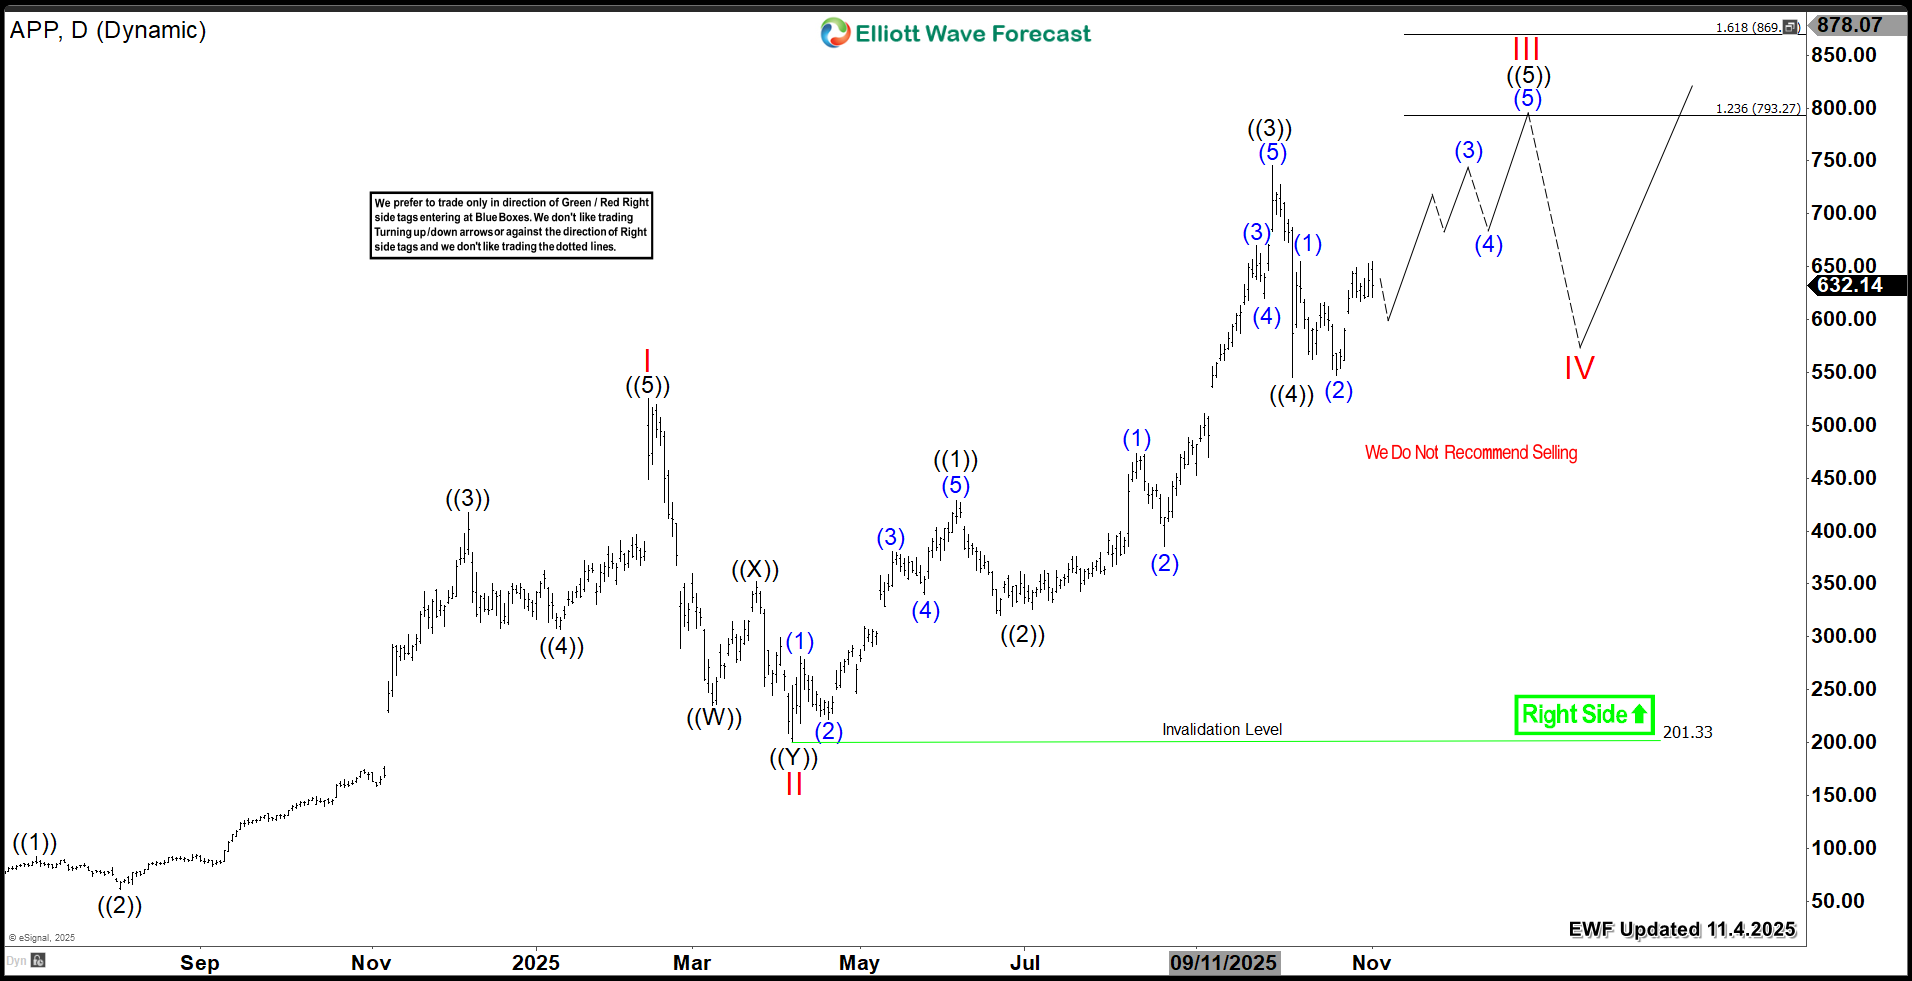
Applovin started 2025 with weakness. However, the stock rallied into new all-time highs by Q3’s end. Since April, APP climbed in a three-wave move, signaling wave III remains active. The bullish sequence still looks incomplete.
As long as price holds above wave ((4)) low at $545, APP should extend higher in wave ((5)). The next target zone sits between $793 and $869. After reaching that area, APP may begin a larger wave IV correction which is expected to provide another buying opportunity within the daily cycle against $201 low.
AppLovin (APP) Daily Chart 11.4.2025
Conclusion
APP stock shows a strong bullish sequence on the daily chart. Therefore, traders should treat pullbacks as buying opportunities. Use our Elliott Wave strategy to time entries with precision. Enter after a 3-, 7-, or 11-swing correction completes. Additionally, our proprietary Blue Box system highlights high-probability zones with pinpoint accuracy. As a result, this disciplined method gives traders the clarity and confidence to catch the next bullish leg.
免責事項:本記事で述べられている見解は著者の見解のみであり、Followmeの公式見解を反映するものではありません。Followmeは、提供された情報の正確性、完全性、信頼性について一切責任を負いません。また、書面で明示的に記載されている場合を除き、本記事の内容に基づいて行われたいかなる行動についても責任を負いません。

