


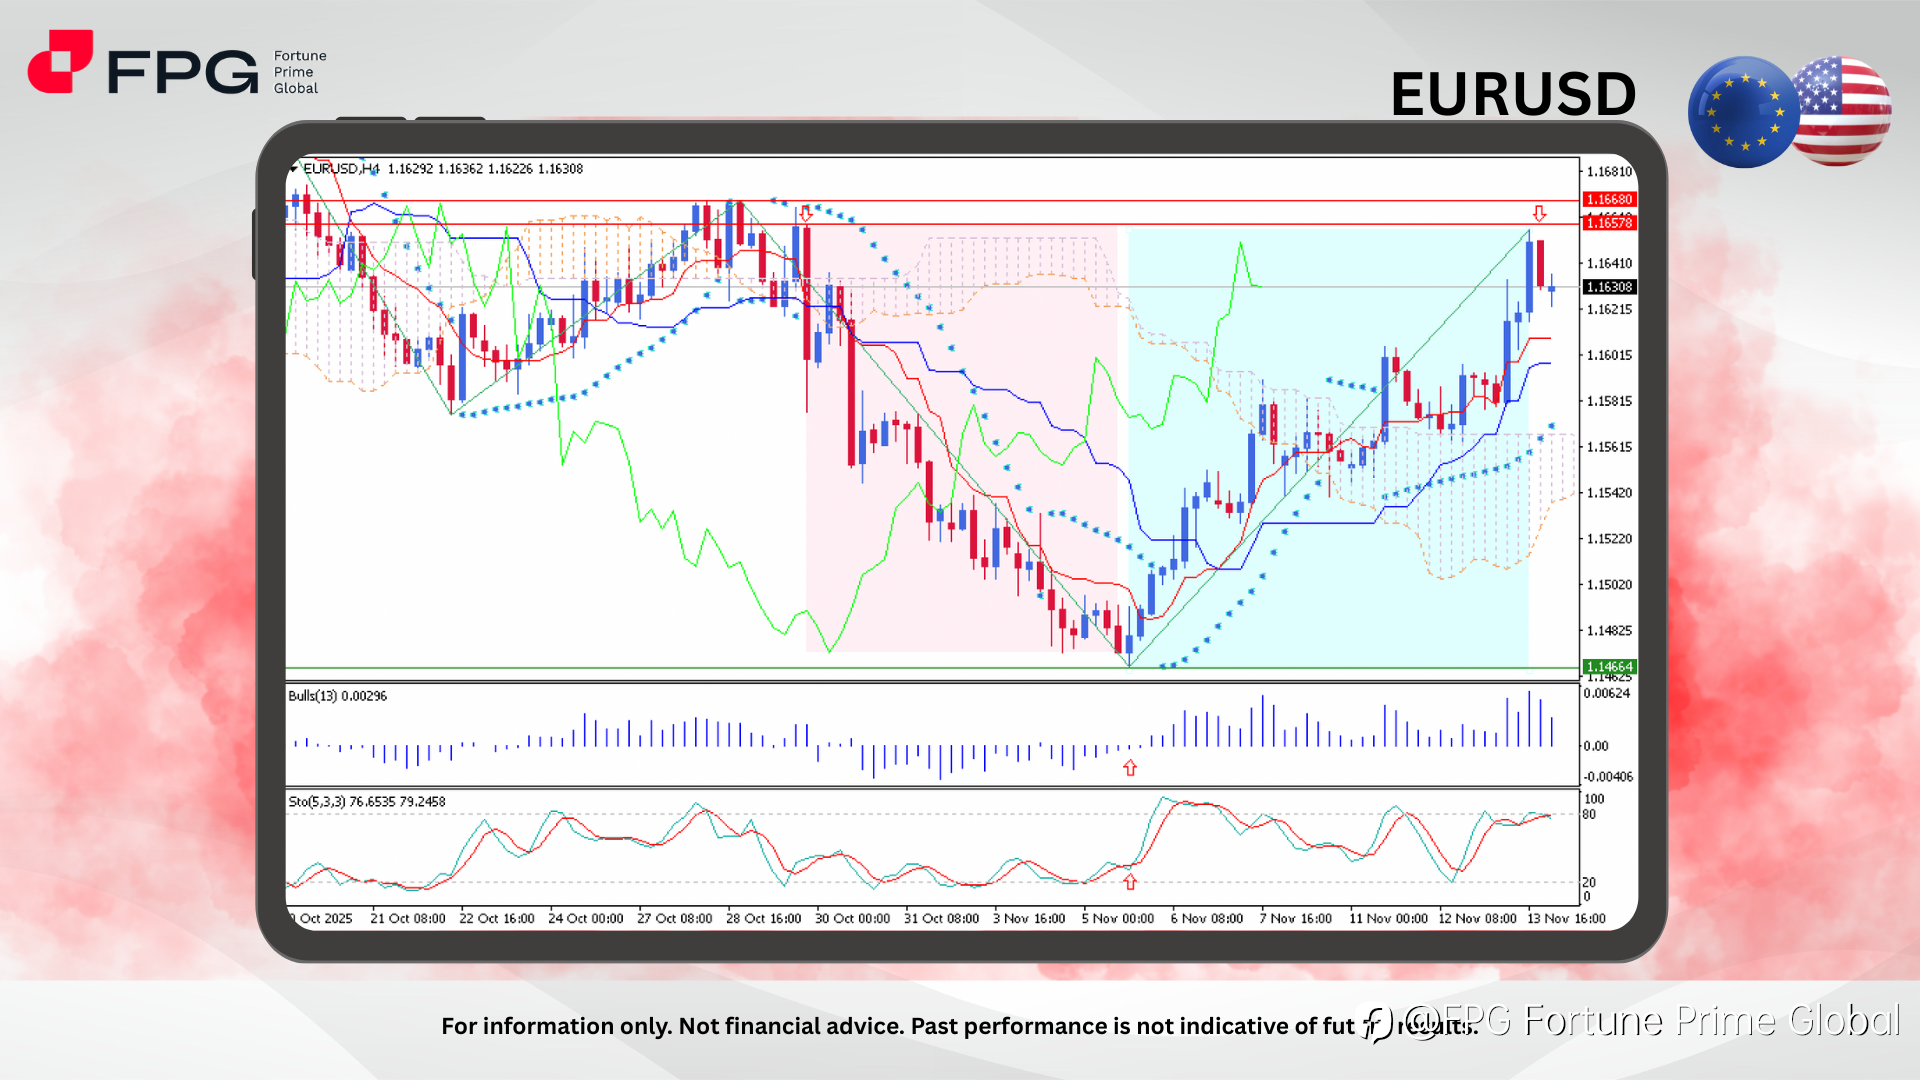
EURUSD on the H4 timeframe chart, a clear V-shape pattern can be seen, dropped from 1.1657 and rebounded at 1.1466, then rallied bullishly back to 1.1657. The current price is floating around 1.1630, maintaining upward traction after a strong recovery phase. Price is still supported by an ascending short-term trendline, signaling that bullish momentum remains intact despite the pair pulling slightly away from the recent highs.
EURUSD continues to trade above the Kijun-sen and Tenkan-sen lines, reinforcing short-term bullish control. The latest rally broke above the Ichimoku cloud before stabilizing just under the major resistance at 1.1657–1.1668, an area that has repeatedly triggered pullbacks. The Parabolic SAR remains positioned below the candles, indicating that upward pressure is still present, although the slope of the trendline suggests momentum is beginning to cool.
From an indicator perspective, Bulls Power is positive, showing steady buying interest, while the Stochastic Oscillator (5,3,3) is hovering around 76.65 / 79.24, placing the pair in upper territory but not yet giving a clear reversal signal. Combined with the recent impulsive breakout from the cloud, EURUSD still carries continuation potential, provided it stays above nearby support zones. Keep an eye on today’s key economic events, especially those that have a direct impact on major pairs.
Market Observation & Strategy Advice
1. Current Position: EURUSD is trading around 1.1630, extending its recovery from 1.1466. Price remains above the ascending trendline, showing bullish momentum is still dominant despite hesitation near the higher boundary.
2. Resistance Zone: Immediate resistance stands at 1.1657–1.1668, a critical reaction zone. A successful breakout above this range could open the path toward 1.1720, and further toward 1.1800 if bullish momentum strengthens.
3. Support Zone: Key support lies at 1.1600, followed by 1.1550 and 1.1500. Holding above these zones is essential to maintain the current bullish structure; a break below may invite broader corrective pressure.
4. Indicators: Ichimoku shows the price holding above the cloud, reflecting bullish bias. Parabolic SAR remains below the candles, confirming upward traction. Stochastic Oscillator stays in upper levels, signaling potential continuation, while Bulls Power remains positive, showing ongoing buying strength.
5. Trading Strategy Suggestions:
- Buy on Pullbacks: Long positions can be considered near 1.1600–1.1585, targeting 1.1668 and 1.1720, with stops below 1.1550.
- Breakout Play: A clean break above 1.1668 may open momentum buys targeting 1.1720–1.1800.
- Risk Management: Utilize trailing stops as EURUSD approaches resistance, considering potential reversals from overbought momentum.
Market Performance:
Forex Last Price % Change
USD/JPY 154.68 +0.11%
GBP/USD 1.3139 −0.39%
Today’s Key Economic Calendar:
US: Fed Musalem and Hammack Speech
AU: RBA McPhee Speech
CN: Industrial Production YoY
CN: Retail Sales YoY
EU: Balance of Trade
EU: Employment Change QoQ & YoY Prel
US: PPI MoM
US: Retail Sales MoM
Risk Disclaimer: This report is for informational purposes only and does not constitute financial advice. Investments involve risks, and past performance does not guarantee future results. Consult your financial advisor for personalized investment strategies.
免責事項:本記事で述べられている見解は著者の見解のみであり、Followmeの公式見解を反映するものではありません。Followmeは、提供された情報の正確性、完全性、信頼性について一切責任を負いません。また、書面で明示的に記載されている場合を除き、本記事の内容に基づいて行われたいかなる行動についても責任を負いません。

