



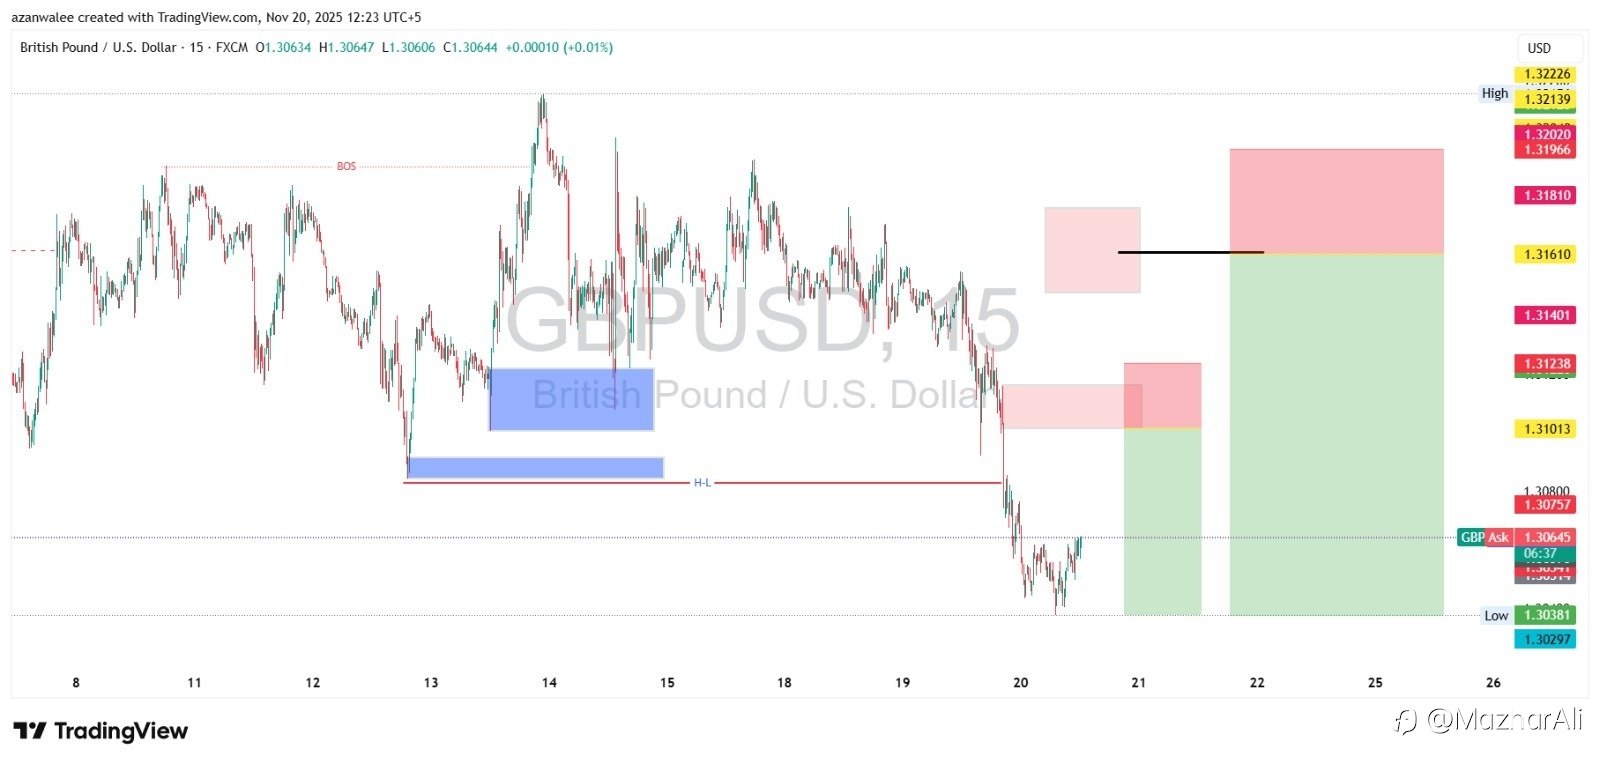
GBPUSDis currently respecting a clear bearish market structure after breaking below the recent Higher-Low (HL) level. The Break of Structure (BOS) confirmed bearish control, pushing price into a new downside leg.
🔻 Market Structure
- Price has created a fresh lower low, confirming continuation of the downtrend.
- Previous bullish demand zone (highlighted in blue) failed to hold, signalling weakening buyers.
- Current reaction shows price trading near intraday lows, maintaining bearish sentiment.
🔴 Supply Zones Identified
Two important supply areas are visible:
- Major supply zone at the top (red), expected to act as strong resistance.
- Internal supply zone that caused the last impulsive drop.
If price retraces into these supply zones, sellers may re-enter the market.
🟢 Bullish Retracement Possibility
Price is currently showing a minor corrective bounce.
A pullback into the supply zones may offer sell opportunities aligning with the higher-timeframe trend.
🎯 Trade Prediction (Based on Chart Zones)
- Sell Zone: 1.3140 – 1.3180 (major supply)
- Target TP: 1.3030 – 1.2980
- Stop Loss: Above 1.3180 zone
📌 Why Bearish?
- Strong BOS on the downside
- Failure of demand
- Momentum clearly favors sellers
- Clean liquidity areas below price remain unmitigated
📉 Overall Outlook
GBPUSD remains bearish, and any pullback into the highlighted supply zones may give continuation setups toward the lower liquidity targets.
免責事項:本記事で述べられている見解は著者の見解のみであり、Followmeの公式見解を反映するものではありません。Followmeは、提供された情報の正確性、完全性、信頼性について一切責任を負いません。また、書面で明示的に記載されている場合を除き、本記事の内容に基づいて行われたいかなる行動についても責任を負いません。

