



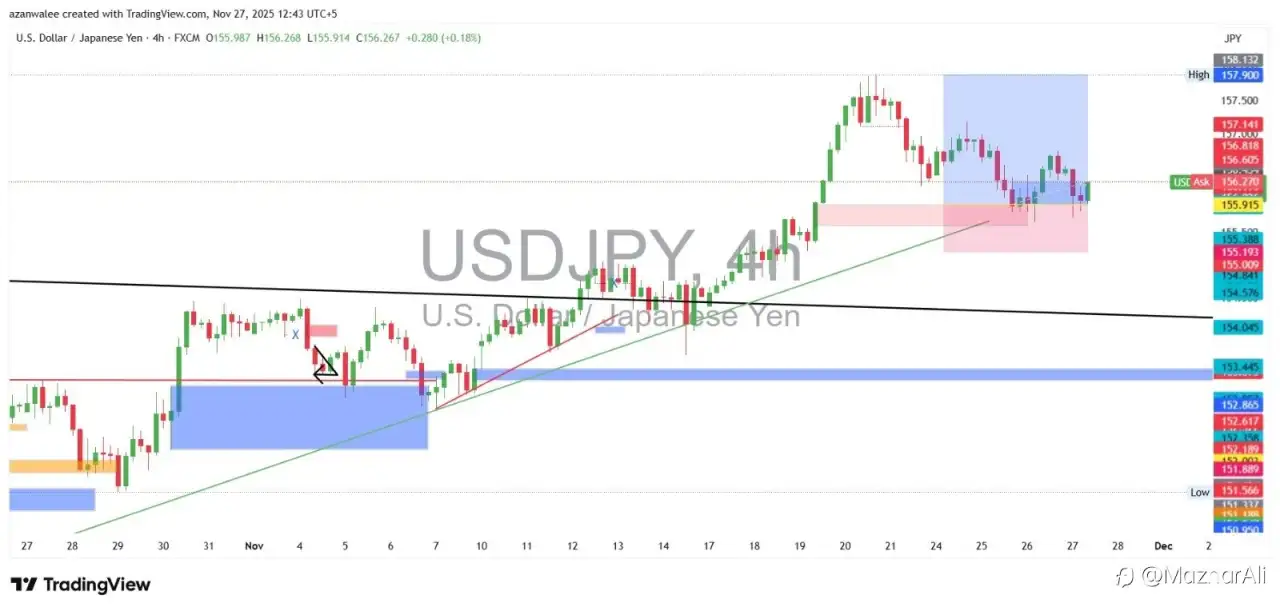
Price has been riding a strong bullish trend for weeks, and the chart still reflects that broader upside structure—but momentum has clearly cooled off. After tapping the 158.10–157.90 zone, buyers lost steam and the pair slid into a corrective phase.
The current pullback has dropped into a demand region around 156.00–155.80, which aligns with the rising trendline drawn from early November. The market has reacted here before, and you can see buyers attempting to defend it again. As long as price holds above 155.90, bulls keep a slight structural advantage.
However, that last swing high failed to continue with the same energy—classic sign of exhaustion. If price loses this demand zone, the next pocket of liquidity sits deeper near 154.05, a level that previously acted as strong support.
On the upside, the 157.40–157.80 zone remains the key supply cap. A clean break above it reopens the path back toward the recent highs.
In short:
• Buyers are trying to stabilize on support, but momentum isn’t fully convincing.
• Losing the trendline 155.80 opens the door to a sharper correction.
• Holding above it keeps the bullish structure alive.
The pair is at a decision point, and this compression usually leads to a strong push in one direction.
27 Nov 2025, 15:53 を編集しました
免責事項:本記事で述べられている見解は著者の見解のみであり、Followmeの公式見解を反映するものではありません。Followmeは、提供された情報の正確性、完全性、信頼性について一切責任を負いません。また、書面で明示的に記載されている場合を除き、本記事の内容に基づいて行われたいかなる行動についても責任を負いません。


-終わり-