



Key Observations
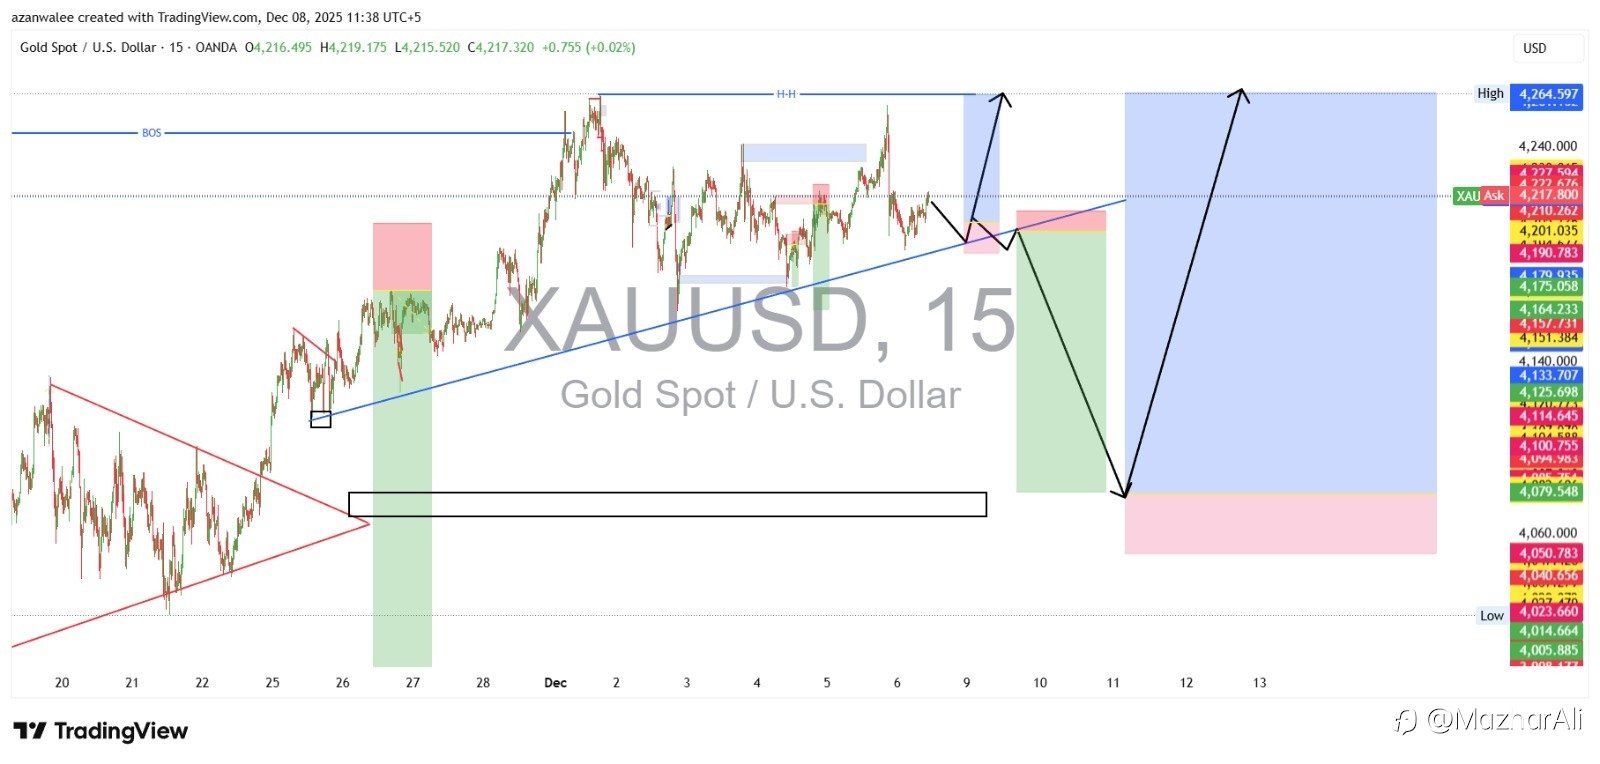
Higher High (HH): The market has established a significant Higher High (HH), indicating a prevailing bullish structure.
Break of Structure (BOS): There was a recent Break of Structure (BOS) to the upside, confirming the strength of the bullish momentum.
Ascending Trendline: Price is currently respecting and moving along an ascending trendline. This serves as a dynamic support level.
Current Price Action: Price is consolidating slightly below a recent swing high, showing indecision after the last upward movement.
💡 Potential Trade Setup: Short-Term Sell (Counter-Trend)
The most prominent pattern on the chart suggests a high-probability short-term selling opportunity based on the potential exhaustion of the current move and the presence of supply.
| Element | Description |
| Entry Zone (Supply) | The entry is set near the last resistance/swing high ($4,227 - $4,230$ area), which aligns with the potential break of the ascending trendline. |
| Stop Loss (S/L) | Placed above the most recent HH to protect against a continuation of the primary trend ($4,264$ area). |
| Take Profit (T/P) Zone | The target is a significant Demand Zone or Order Block much lower, identified by the large black box ($4,100 - $4,079$ area). This target represents a likely origin point for the next major leg up. |
| Trigger Condition | The trade is triggered upon a break and retest (or a clear rejection) of the ascending trendline and the failure to make a new higher high. |
Rationale for the Sell:
The structure anticipates a deep retracement into a strong demand zone before the main bullish trend can continue. Traders who believe the short-term structure is overextended may look for this counter-trend move.
🎯 Alternative Scenario: Continuation of Bullish Trend (Primary)
If the market maintains strength and the ascending trendline holds, the primary bullish outlook remains valid.
Bullish Entry: Look for a buy entry at the demand zone/order block immediately below the current consolidation area (the lower pink box/flag limit) or a bounce off the ascending trendline.
Target: A break of the current HH, aiming for a new swing high ($4,264$ and higher).
Disclaimer: This analysis is for educational purposes only and should not be considered financial advice. Trading foreign exchange and commodities involves significant risk, and you could lose your money.
免責事項:本記事で述べられている見解は著者の見解のみであり、Followmeの公式見解を反映するものではありません。Followmeは、提供された情報の正確性、完全性、信頼性について一切責任を負いません。また、書面で明示的に記載されている場合を除き、本記事の内容に基づいて行われたいかなる行動についても責任を負いません。

