


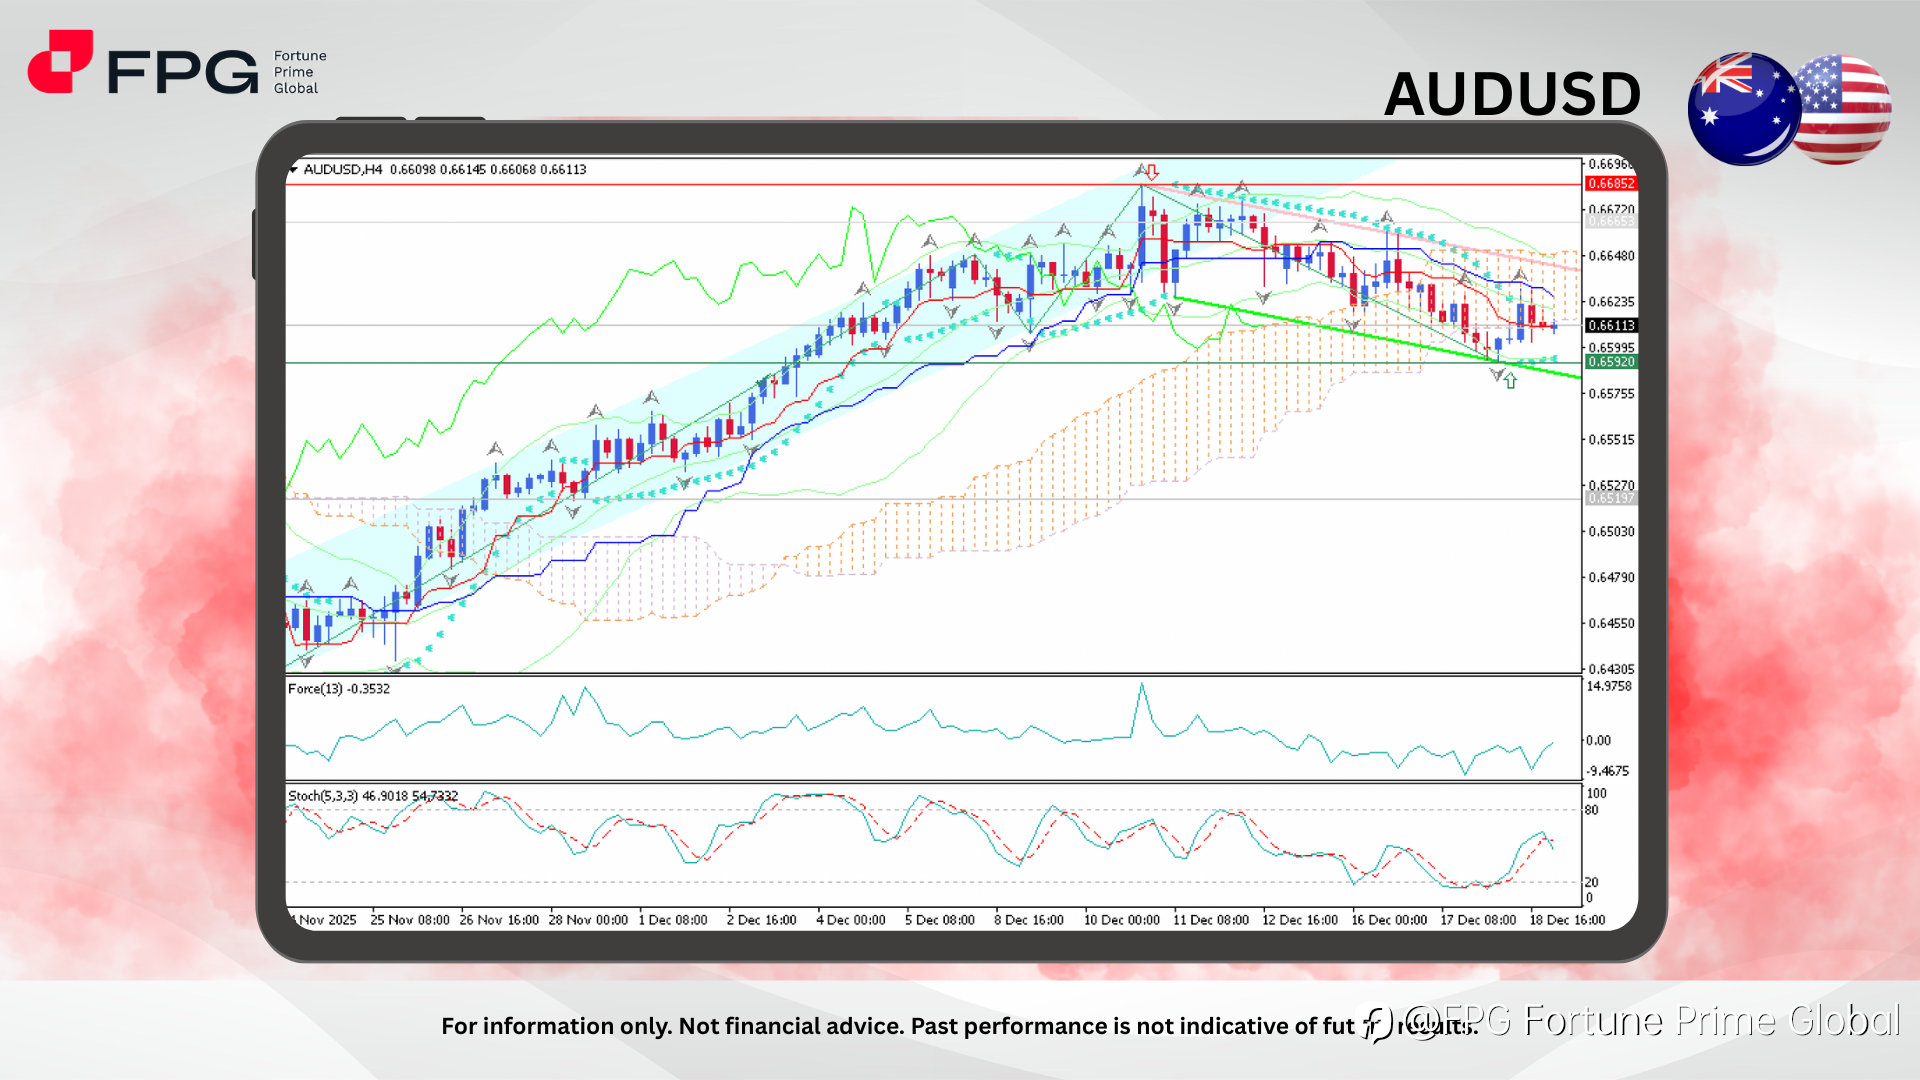
On the AUDUSD H4 chart, the pair is showing a clear trend reversal after maintaining a strong and consistent bullish trend since November. The bullish rally peaked near 0.6685, where price faced firm rejection, signaling the emergence of selling pressure. Following this rejection, AUDUSD entered a corrective phase and is now trading around 0.6611, moving within a well-defined bearish channel, indicating a shift in medium-term market control from buyers to sellers.
Price action is currently positioned below key short-term moving averages and drifting toward the lower Bollinger Band, reflecting sustained downside pressure. The Ichimoku Cloud has begun to act as dynamic resistance, with price trading below the cloud structure, reinforcing the bearish bias. Force Index (13) remains mostly in negative territory, confirming weakening bullish participation and persistent selling momentum. Meanwhile, Stochastic Oscillator (5,3,3) is recovering from oversold levels but remains below the mid-range, suggesting that any short-term bounce is likely corrective rather than a confirmed bullish reversal.
The transition from a prolonged bullish trend into a bearish channel highlights a structural shift in momentum, which generally appears to be driven by impactful fundamental factors. This condition suggests that AUDUSD may continue its bearish trajectory today, especially if selling pressure remains dominant. With several upcoming economic news releases that could directly or indirectly influence both AUD and USD sentiment, traders should remain highly attentive, as these events may trigger sharp price reactions and increased volatility.
Market Observation & Strategy Advice
1. Current Position: AUDUSD is currently trading around 0.6611, consolidating within a bearish channel after rejecting the prior bullish peak.
2. Resistance Zone: Immediate resistance is located around 0.6648 – 0.6685, aligning with channel resistance and the prior rejection zone. A sustained break above this area would weaken the bearish structure.
3. Support Zone: Key support is seen near 0.6592, followed by deeper support at 0.6550, which represents a significant demand area from previous price structure.
4. Indicators: Force Index remains negative, Stochastic Oscillator signals corrective recovery only, and Ichimoku Cloud positioning continues to support bearish bias.
5. Trading Strategy Suggestions:
- Bearish continuation setup: Look for sell opportunities on rejection near 0.6645 – 0.6680, targeting 0.6590 and 0.6550, with stops above 0.6690.
- Breakdown strategy: Consider short positions on a confirmed H4 close below 0.6590, aiming toward 0.6550.
- Risk management: Stay cautious around high-impact economic releases that could trigger sharp volatility spikes.
Market Performance:
Forex Last Price % Change
EUR/USD 1.1722 +0.01%
USD/JPY 155.67 +0.14%
Today’s Key Economic Calendar:
US: Net Long-term TIC Flows
JP: Inflation Rate YoY
UK: GfK Consumer Confidence
JP: BoJ Interest Rate Decision
DE: GfK Consumer Confidence
UK: Retail Sales MoM & YoY
UK: CBI Distributive Trades
CA: New Housing Price Index MoM
CA: Retail Sales MoM Final & Prel
EU: Consumer Confidence Flash
US: Existing Home Sales
US: Michigan Consumer Sentiment Final
Risk Disclaimer: This report is for informational purposes only and does not constitute financial advice. Investments involve risks, and past performance does not guarantee future results. Consult your financial advisor for personalized investment strategies.
免責事項:本記事で述べられている見解は著者の見解のみであり、Followmeの公式見解を反映するものではありません。Followmeは、提供された情報の正確性、完全性、信頼性について一切責任を負いません。また、書面で明示的に記載されている場合を除き、本記事の内容に基づいて行われたいかなる行動についても責任を負いません。

