Applied Digital Corp (NASDAQ: APLD) operates at the intersection of digital infrastructure and AI innovation. Recent sector tailwinds have fueled strong momentum for the stock. Today, we analyze the Elliott Wave pattern behind its current pullback and emerging buying opportunity.
Elliott Wave Analysis
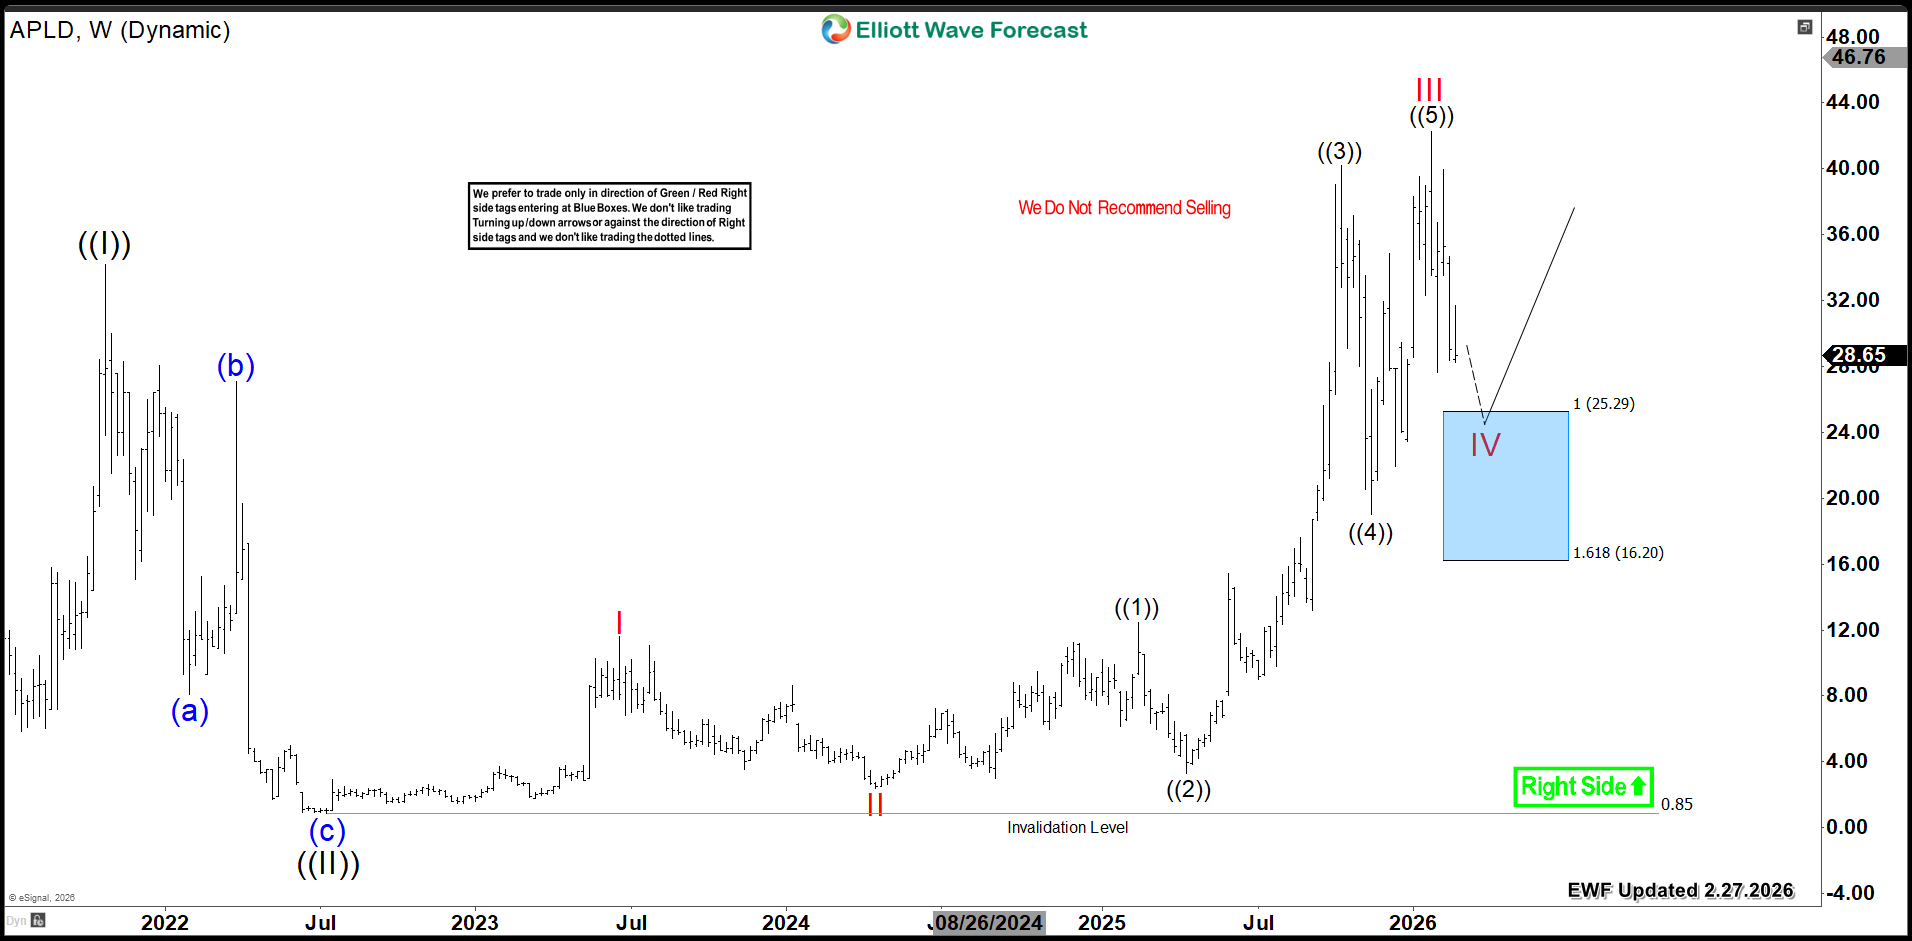
From its 2022 low, APLD created a bullish three-wave advance to new highs. Wave I ended at $11.62, followed by Wave II at $2.36. Then, Wave III rallied to $42.27. Currently, Wave IV is in progress. Therefore, the stock has an incomplete bullish sequence. It aims to complete five waves within wave (I) before a larger correction begins.
The projected Wave IV correction targets the $25.29 - $16.20 Blue Box zone. This high-frequency area should attract buyers. Consequently, price will react to the upside from this zone. It will either resume the rally to new highs or produce a three-wave bounce at minimum.
APLD's next upside move could drive the stock higher. Specifically, it targets the $46 - $52 area within wave V. This advance will occur before the next major correction begins.
APLD Weekly Chart 2.27.2026
免責事項:本記事で述べられている見解は著者の見解のみであり、Followmeの公式見解を反映するものではありません。Followmeは、提供された情報の正確性、完全性、信頼性について一切責任を負いません。また、書面で明示的に記載されている場合を除き、本記事の内容に基づいて行われたいかなる行動についても責任を負いません。

古いコメントはありません。ソファをつかむ最初のものになりましょう。