


The Global X Uranium ETF (URA) offers investors diversified exposure to companies engaged in uranium mining and nuclear component production, making it a key vehicle for those looking to participate in the nuclear energy transition. In this article, we will explore the long term technical outlook using Elliott Wave.
URA Elliott Wave Chart Monthly Chart
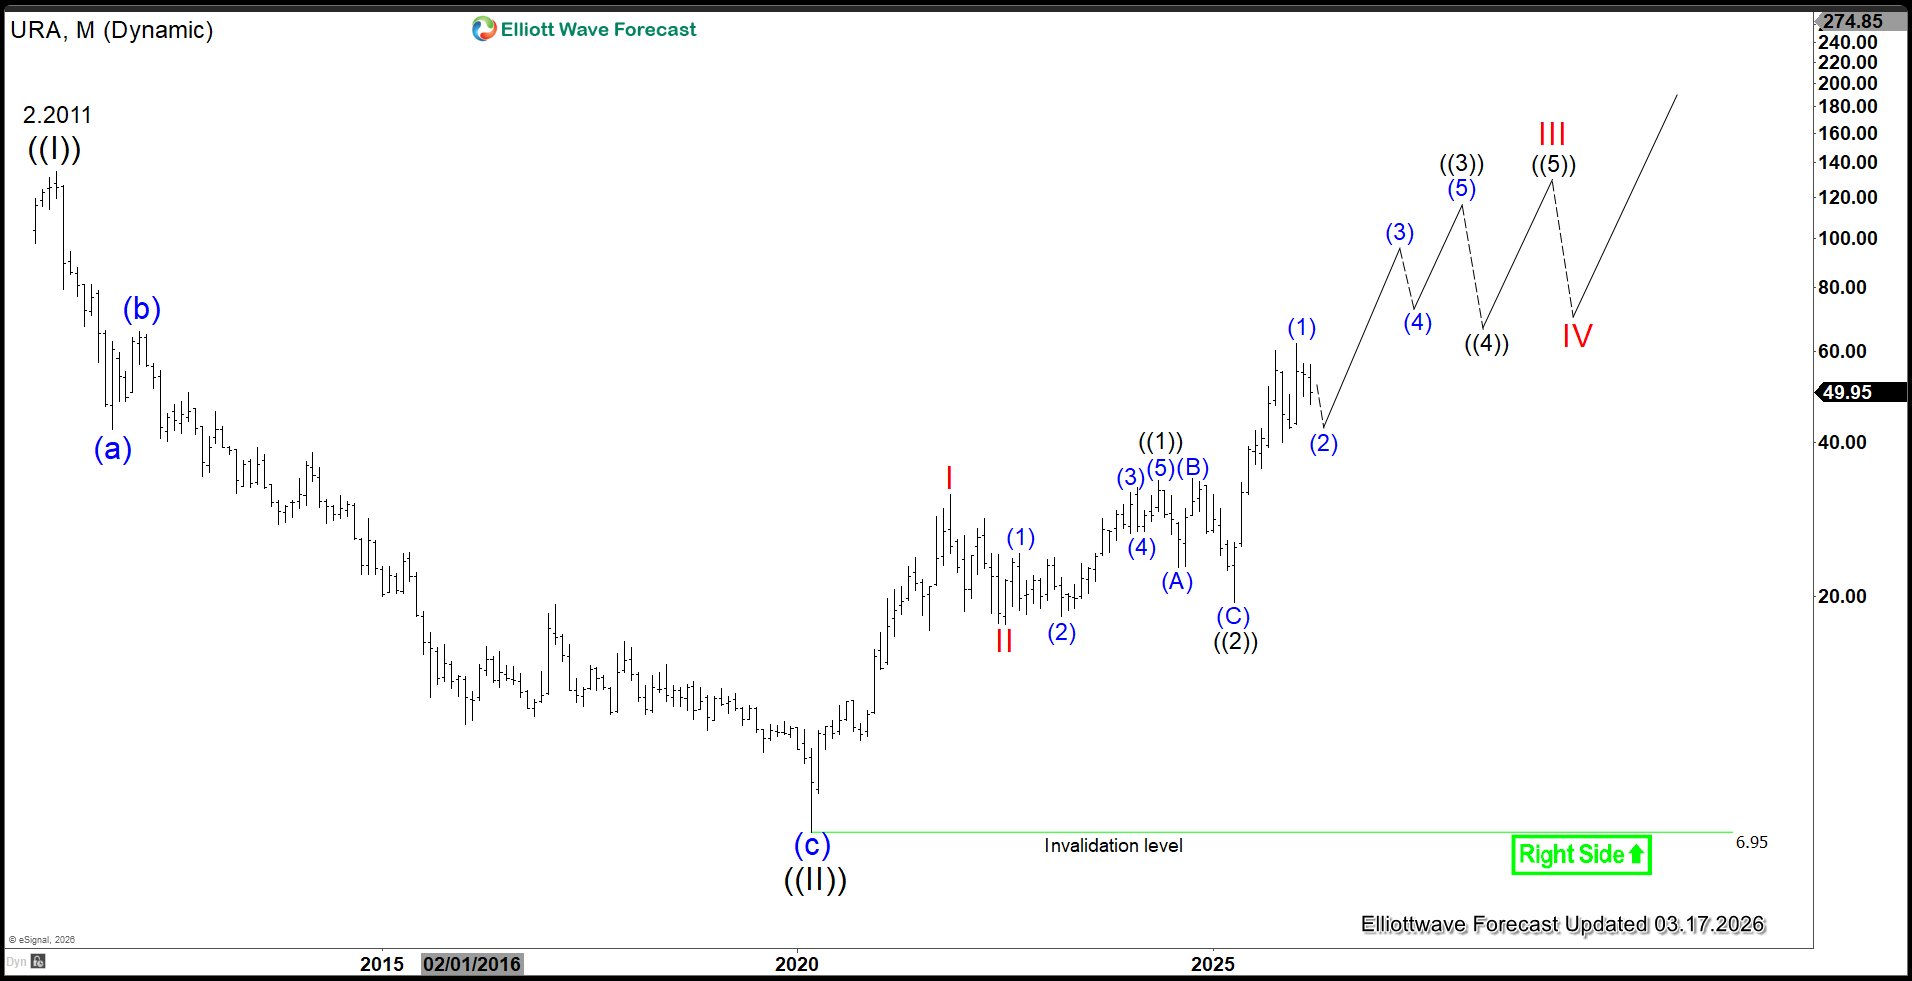
The monthly Elliott Wave chart of Uranium Miners ETF (URA) above shows that it has ended wave ((II)) grand super cycle degree at $6.95. It has started a new bullish leg in wave ((3)) with internal subdivision as a 5 waves impulse. Up from wave ((II)), wave I ended at $31.6 and wave II ended at $17.65. The ETF then nested higher with wave ((1)) ended at $33.66 and wave ((2)) ended at $19.5. While pivot at $6.95 low stays intact, expect pullback to find buyers in 3 or 7 swing for further upside.
URA Daily Elliott Wave Chart
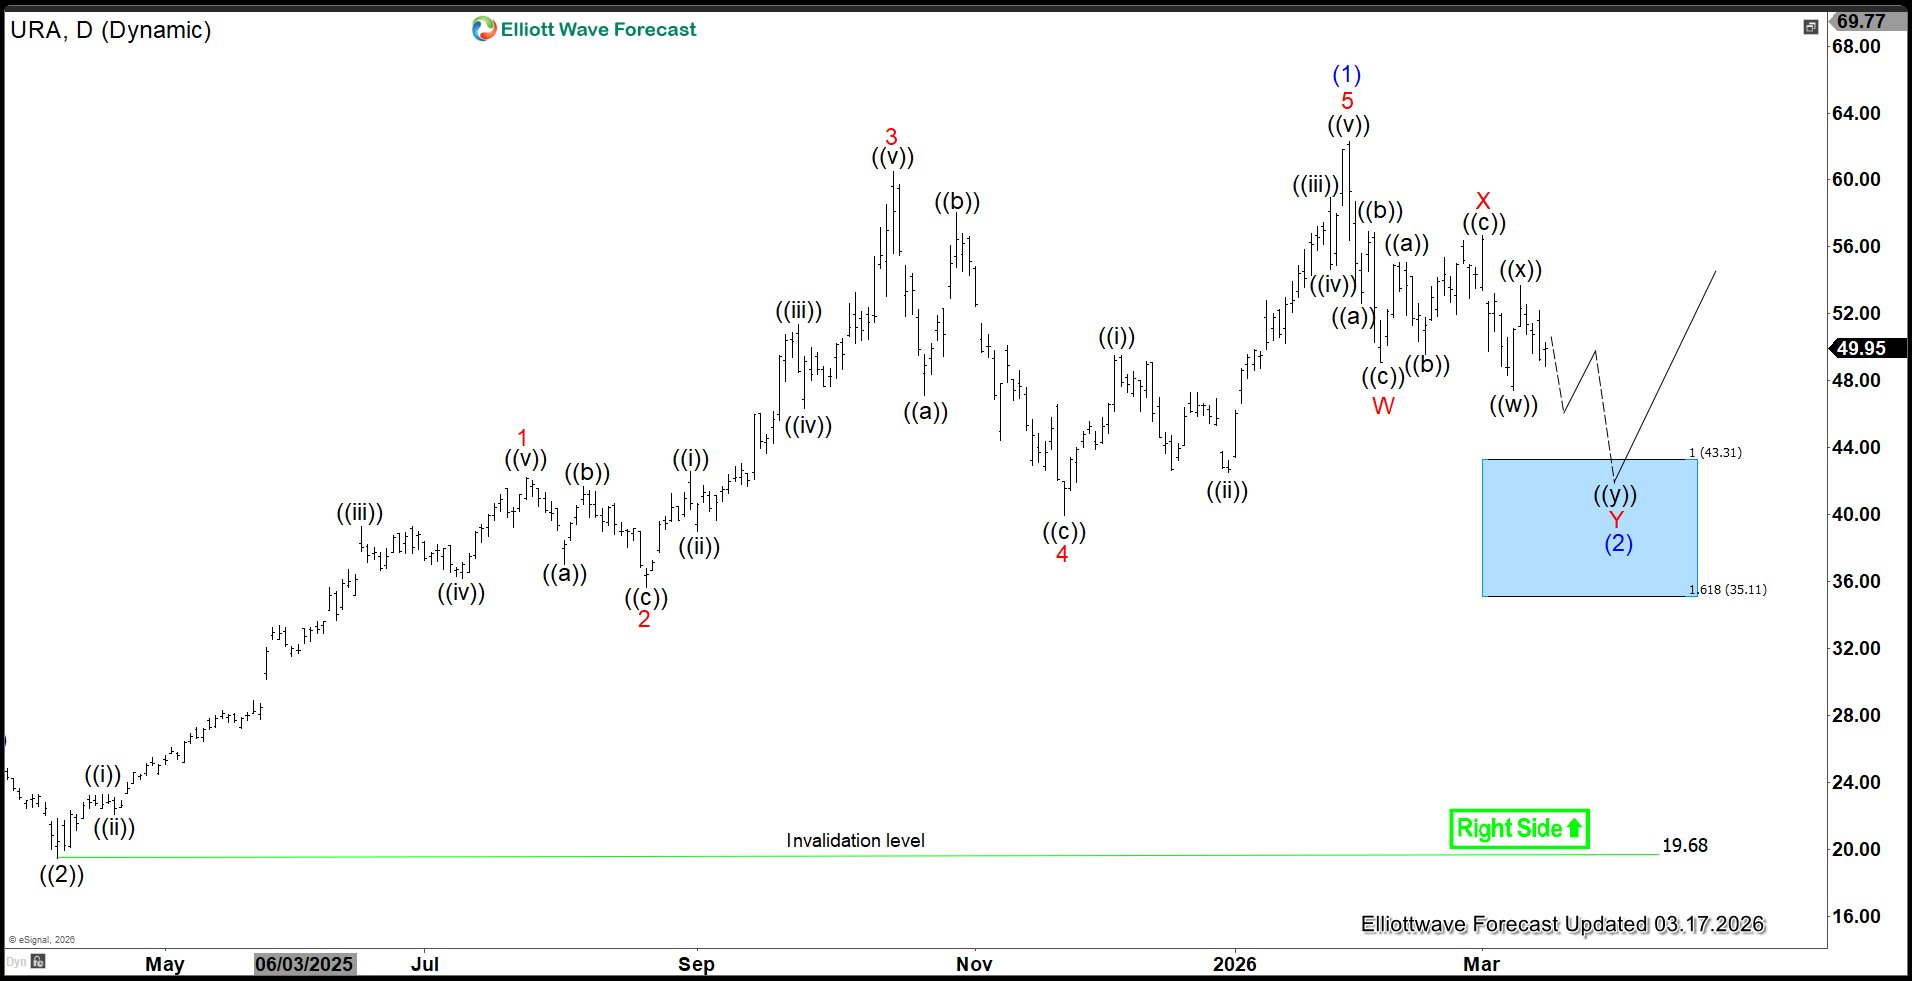
The daily chart of the Uranium ETF shows that the rally from the wave ((2)) low on April 7, 2025, concluded with wave (1) at $62.28, forming a five‑wave diagonal. The current pullback in wave (2) is unfolding as a seven‑swing corrective structure, commonly referred to as a double three. From the wave (1) peak, wave W ended at $49.11, followed by a rally in wave X to $56.66. Wave Y is now in progress, with a 100%–161.8% Fibonacci extension target at $35.11–$43.11 (blue box area). Buyers are expected to emerge from this zone, setting the stage for renewed upside momentum.
免責事項:本記事で述べられている見解は著者の見解のみであり、Followmeの公式見解を反映するものではありません。Followmeは、提供された情報の正確性、完全性、信頼性について一切責任を負いません。また、書面で明示的に記載されている場合を除き、本記事の内容に基づいて行われたいかなる行動についても責任を負いません。

