


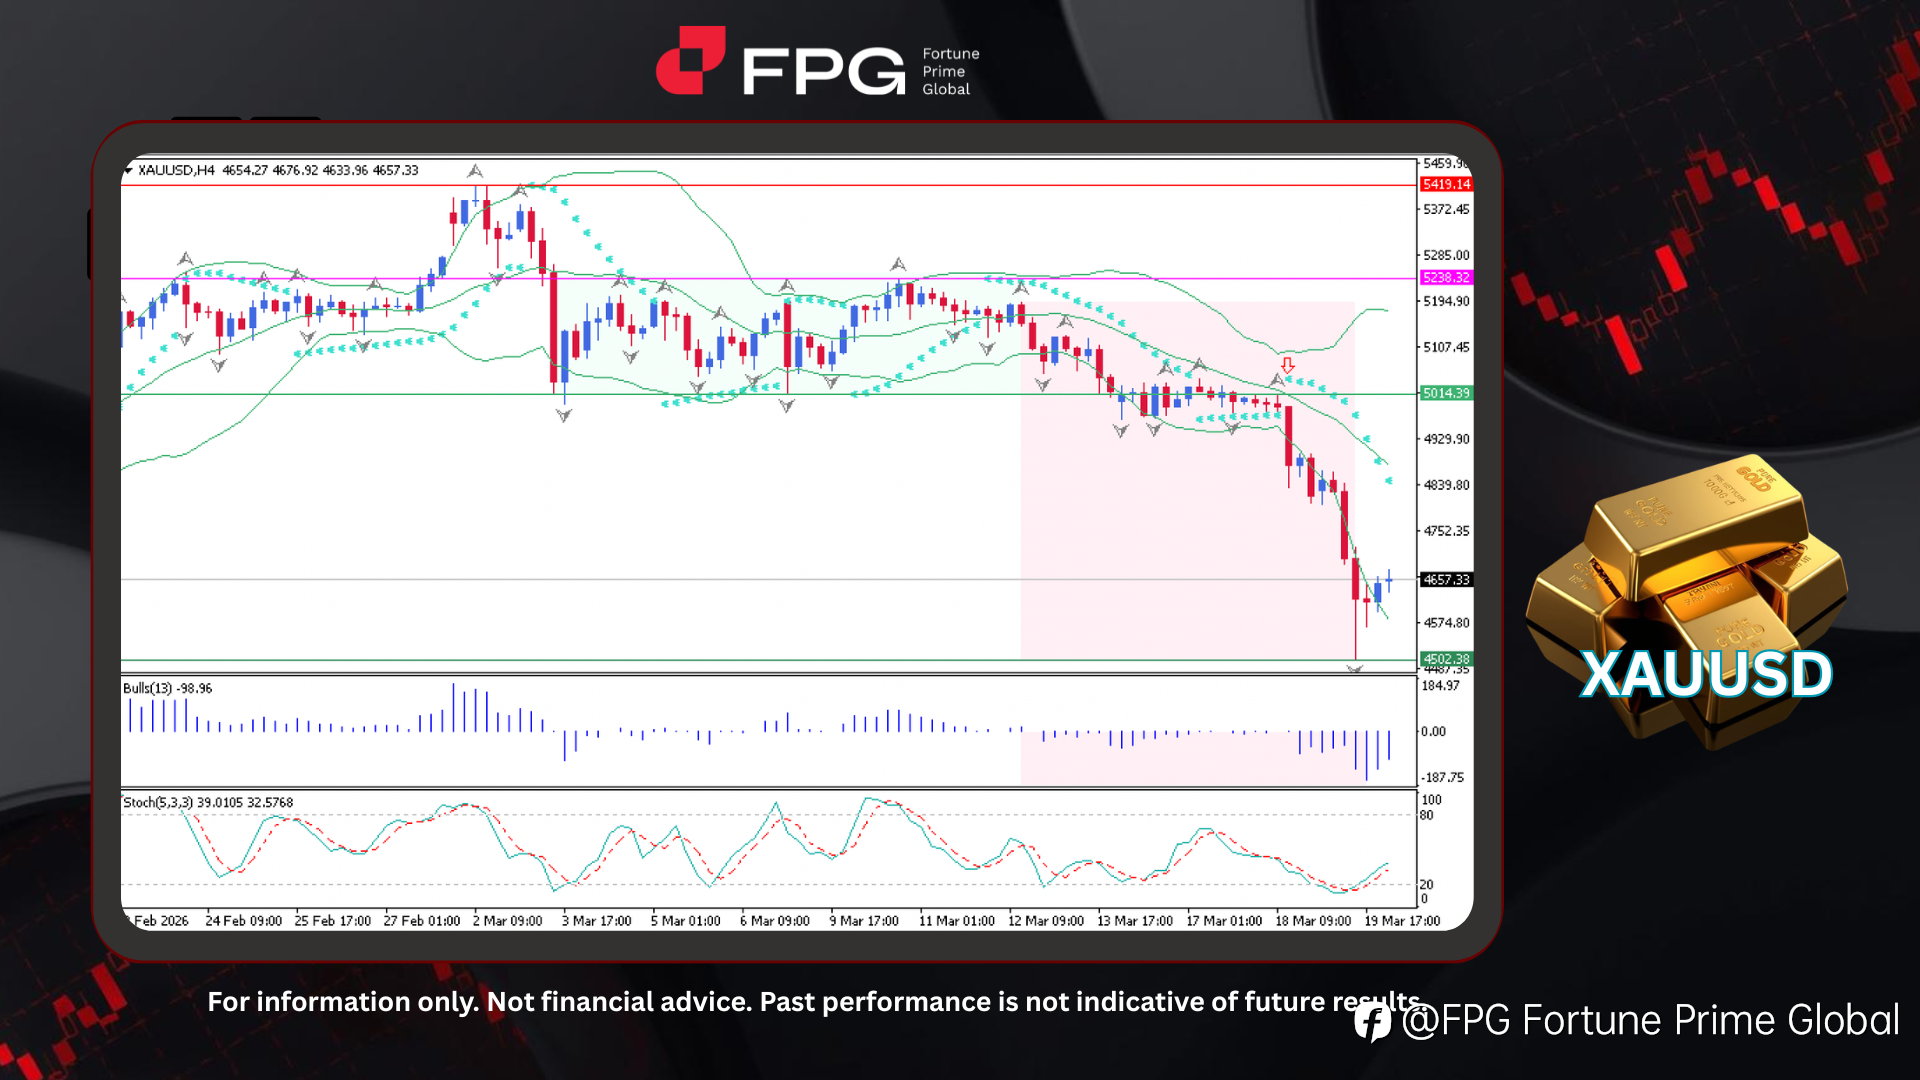
XAUUSD (Gold) on the H4 timeframe chart, after several weeks of relatively stable movement within a sideways channel, finally experienced a clear breakdown, with price dropping sharply from around 5194 to 4502. This bearish move developed over approximately the past week, confirming a shift in market structure from consolidation into strong downside momentum. The current price is around 4657, showing a slight bullish bias as the market attempts a corrective bounce following the recent impulsive decline.
From a technical perspective, price is trading below the Bollinger Bands midline, with band expansion signaling increased volatility and sustained bearish pressure. The Parabolic SAR remains above price, reinforcing the ongoing downtrend despite the short-term rebound. The Bulls Power indicator is still in negative territory, indicating that sellers remain in control, although the histogram shows mild contraction. Meanwhile, the Stochastic oscillator is rising from oversold levels, suggesting a limited corrective upside without confirming a full trend reversal.
Gold prices remain volatile as Middle East tensions combine with a stronger US dollar and continued hawkish expectations from the Federal Reserve. While geopolitical risks typically support safe-haven demand, rising oil-driven inflation is pushing real yields higher and capping upside potential. Fundamentally, central bank demand and global uncertainty continue to support the medium-term outlook, but short-term pressure persists due to currency strength and profit-taking. Technically, the current bounce reflects a corrective phase that may evolve into continuation if bullish momentum strengthens.
Technical Market Overview
1. Current Position: XAUUSD is trading around 4657, showing a mild corrective bounce after a sharp decline from the 5194 high to the 4502 low, indicating short-term recovery within a broader bearish trend.
2. Resistance Zone: The nearest resistance is located around 4800–4900, aligning with recent consolidation and dynamic resistance, while a stronger resistance zone stands near 5014 as a key structural level.
3. Support Zone: Immediate support is positioned near 4502, the recent swing low, which acts as a critical demand zone and downside reference level.
4. Indicator Observation: Technical indicators remain mostly bearish, with Bollinger Bands expansion signaling volatility, Parabolic SAR above price, and Bulls Power negative, while Stochastic shows a rebound from oversold levels.
5. Technical Summary: The overall structure remains bearish despite the current corrective bounce. Short-term upside potential exists, but it is likely limited unless price breaks above key resistance levels. As long as price stays below the 4900–5014 zone, the market bias remains tilted to the downside with potential continuation of the bearish trend.
Market Performance:
Precious Metals Last Price % Change
XPTUSD 1,961.17 +0.32%
XAGUSD 73.1867 +0.52%
Today’s Key Economic Calendar:
CN: Loan Prime Rate 1Y & 5Y
DE: PPI YoY
CN: FDI (YTD) YoY
EU: Balance of Trade
UK: CBI Industrial Trends Orders
CA: New Housing Price Index MoM
CA: Retail Sales Ex Autos MoM
CA: Retail Sales MoM Final & Preliminary
Risk Disclaimer: This report is for informational purposes only and does not constitute financial advice. Investments involve risks, and past performance does not guarantee future results. Consult your financial advisor for personalized investment strategies.
免責事項:本記事で述べられている見解は著者の見解のみであり、Followmeの公式見解を反映するものではありません。Followmeは、提供された情報の正確性、完全性、信頼性について一切責任を負いません。また、書面で明示的に記載されている場合を除き、本記事の内容に基づいて行われたいかなる行動についても責任を負いません。

