


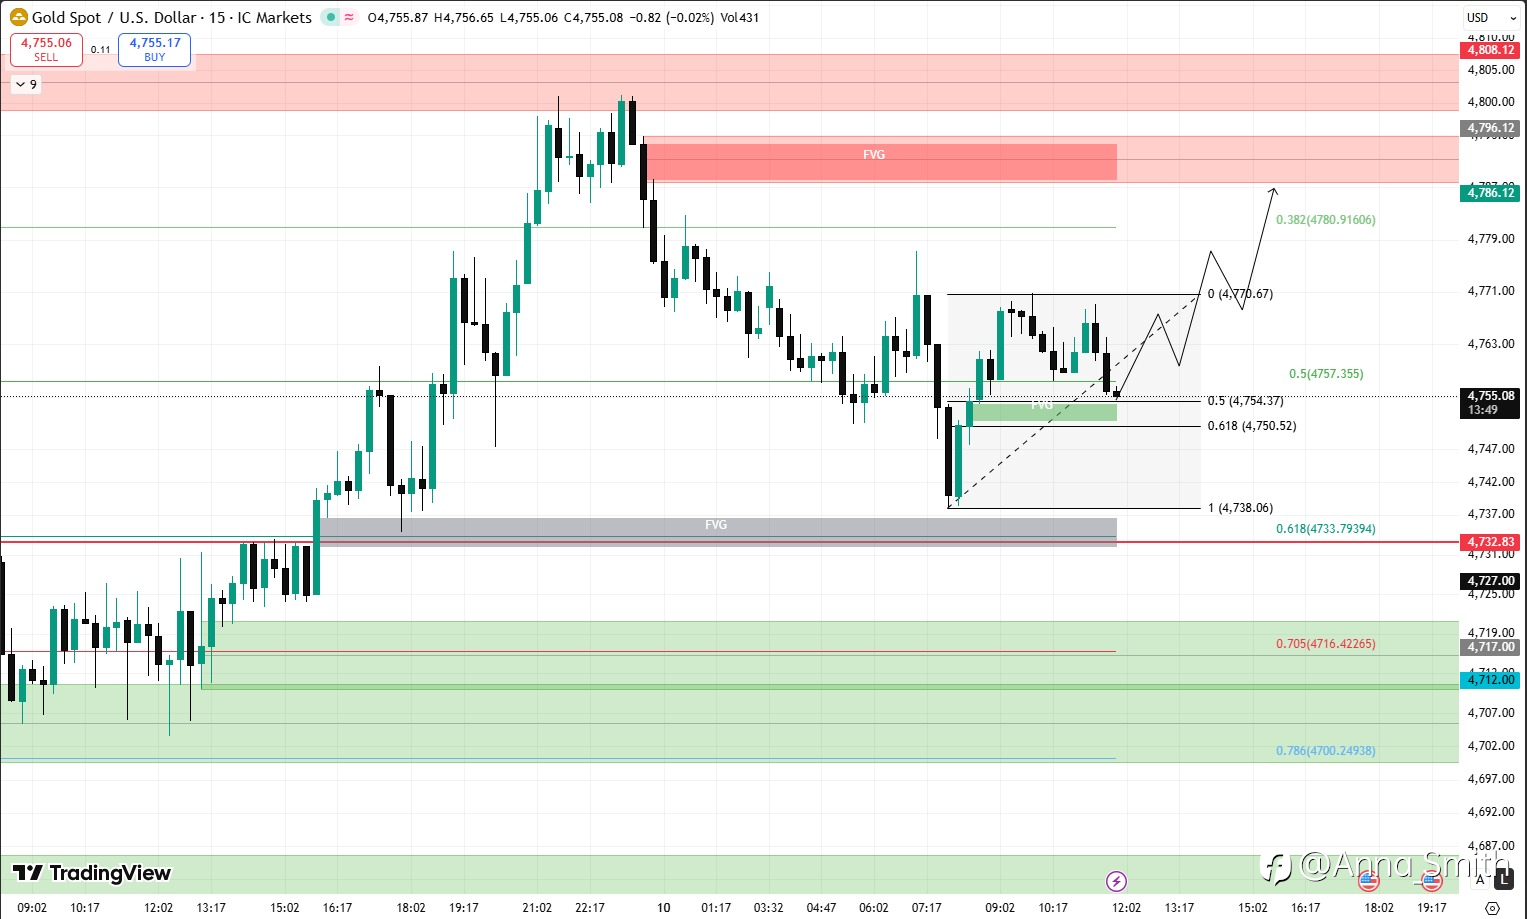
Been watching Gold Spot / U.S. Dollar on the 15-min chart and price just tapped a pretty interesting area.
After the recent drop, gold bounced from a strong lower demand/FVG zone and is now retracing into the 0.5–0.618 Fibonacci area, which often acts as a reaction zone. There’s also a small FVG + structure support around 4754 that the price is currently respecting.
If buyers hold this level, I’m expecting a push back toward the 4770 liquidity area first, and potentially a continuation move toward the 4785–4790 zone where the higher timeframe imbalance sits.
But if this support fails, the market could sweep liquidity below and revisit the deeper demand around 4730–4715.
Personally watching for confirmation before entering.
Question for traders here:
Do you think gold is setting up for a continuation toward 4780+, or are we about to see one more liquidity sweep down first? 👀
免責事項:本記事で述べられている見解は著者の見解のみであり、Followmeの公式見解を反映するものではありません。Followmeは、提供された情報の正確性、完全性、信頼性について一切責任を負いません。また、書面で明示的に記載されている場合を除き、本記事の内容に基づいて行われたいかなる行動についても責任を負いません。

