


· Views 634
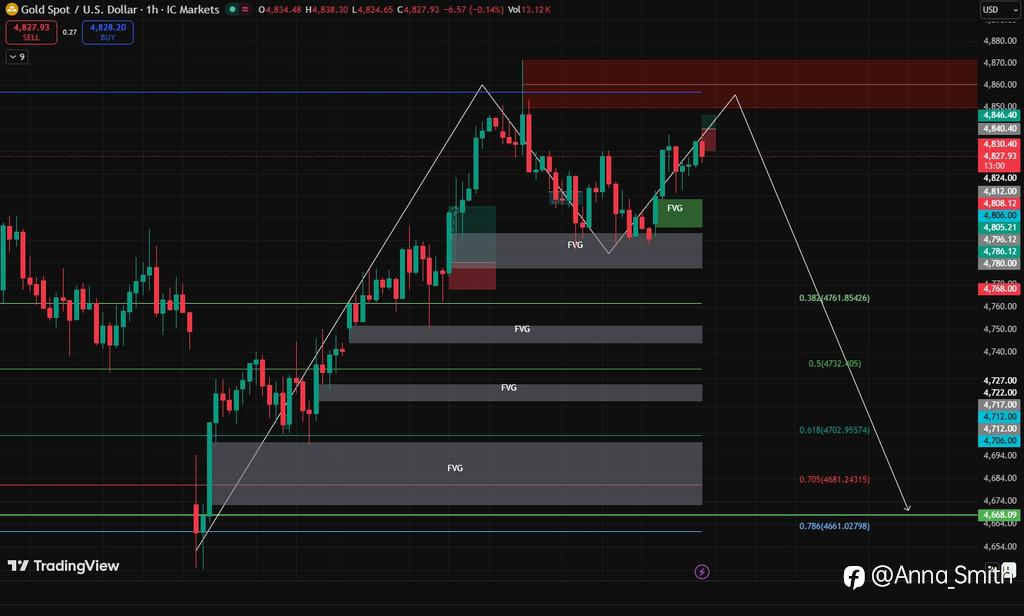
Gold is still in a short-term uptrend.
You can see the price moving inside a rising channel and creating higher highs and higher lows. This shows buyers were controlling the market earlier.
Possible Market Scenario
Based on the structure drawn on the chart:
Step 1: Price pushes slightly higher into resistance
Step 2: Liquidity grab above the highs
Step 3: Sellers enter strongly
Step 4: Price drops toward the lower FVG zones (4720 → 4680)
Key Trading Idea
The market is currently at a decision zone.
Two possibilities:
Bullish Case 📈
- Clean breakout above 4870
- Then continuation higher
Bearish Case 📉 (More likely based on your drawing)
- Fake breakout/rejection at resistance
- Drop toward 4720 – 4680 liquidity zones
FOR PREMIUM TRADE SET UP - https://t.co/WhCVMBY1kM
免責事項:本記事で述べられている見解は著者の見解のみであり、Followmeの公式見解を反映するものではありません。Followmeは、提供された情報の正確性、完全性、信頼性について一切責任を負いません。また、書面で明示的に記載されている場合を除き、本記事の内容に基づいて行われたいかなる行動についても責任を負いません。
この記事が気に入ったら、著者にチップを送って感謝の気持ちを表しましょう。

