


Baidu (NASDAQ: BIDU) has declined 20% year-to-date, underperforming the broader market. However, the stock now shows signs of bottoming. Today, we analyze the Elliott Wave structure behind this pullback. Our analysis reveals BIDU is approaching its next technical reversal zone. We also explain the potential bullish path ahead for the stock.
Elliott Wave Analysis
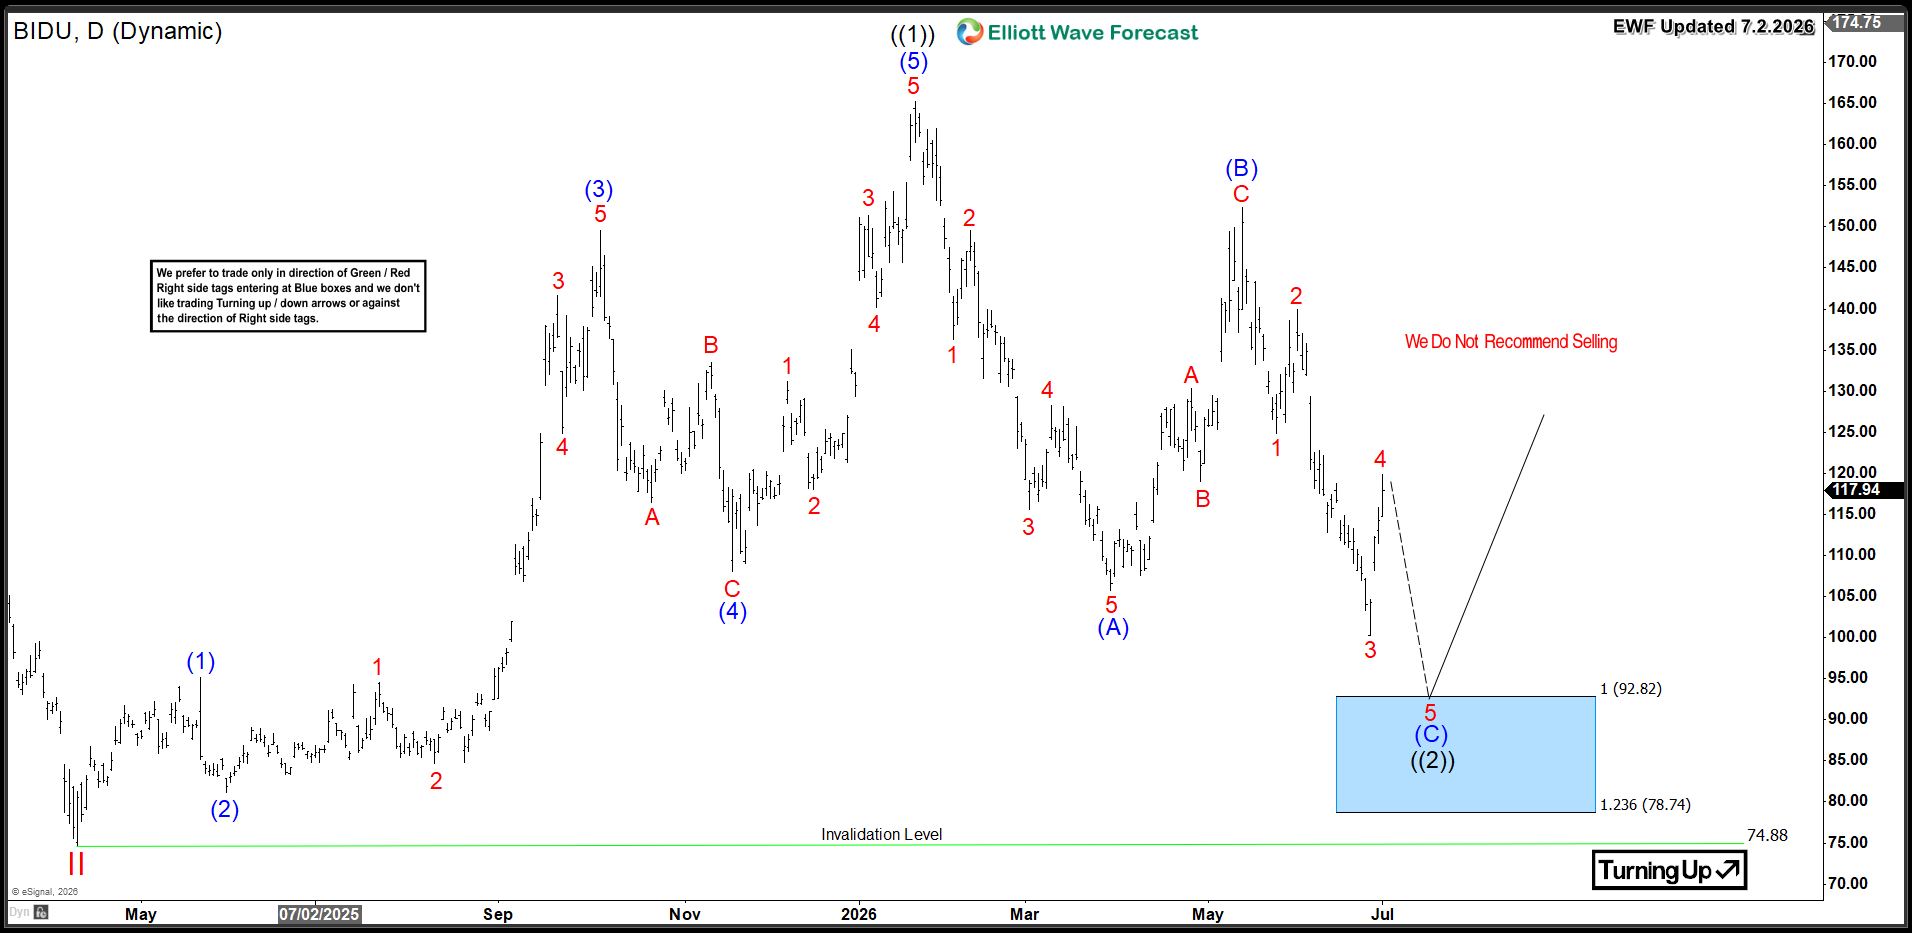
BIDU completed a 5‑wave rally from April 2025 low, peaking at $165. The stock then began a 3‑wave Zigzag correction. Wave (A) dropped to $106, followed by wave (B) rebound to $152. Wave (C) continues lower, still unfolding.
The decline in wave (C) needs another leg down to complete 5 waves, ideally reaching the $92–$78 Blue Box area where buyers often step in at equal legs extreme zones. This area should spark a bullish reversal that could launch a new upside cycle or at minimum trigger a 3‑wave bounce correcting the entire decline.
BIDU Daily Chart 7.2.2026
Conclusion
Baidu’s daily correction is entering its final phase, with a potential dip below $100 to complete the move lower and reach the buying area, so traders should focus on strategic entry points during this corrective dip while anticipating a reversal by year end.
免責事項:本記事で述べられている見解は著者の見解のみであり、Followmeの公式見解を反映するものではありません。Followmeは、提供された情報の正確性、完全性、信頼性について一切責任を負いません。また、書面で明示的に記載されている場合を除き、本記事の内容に基づいて行われたいかなる行動についても責任を負いません。

