


Hut 8 Corp (NASDAQ: HUT) more than doubled earlier this year. Then, it started a correction from its June peak. In today's video blog, we inspect its current Elliott Wave structure. Our analysis explains the potential upside target based on this technical setup.
Elliott Wave Analysis
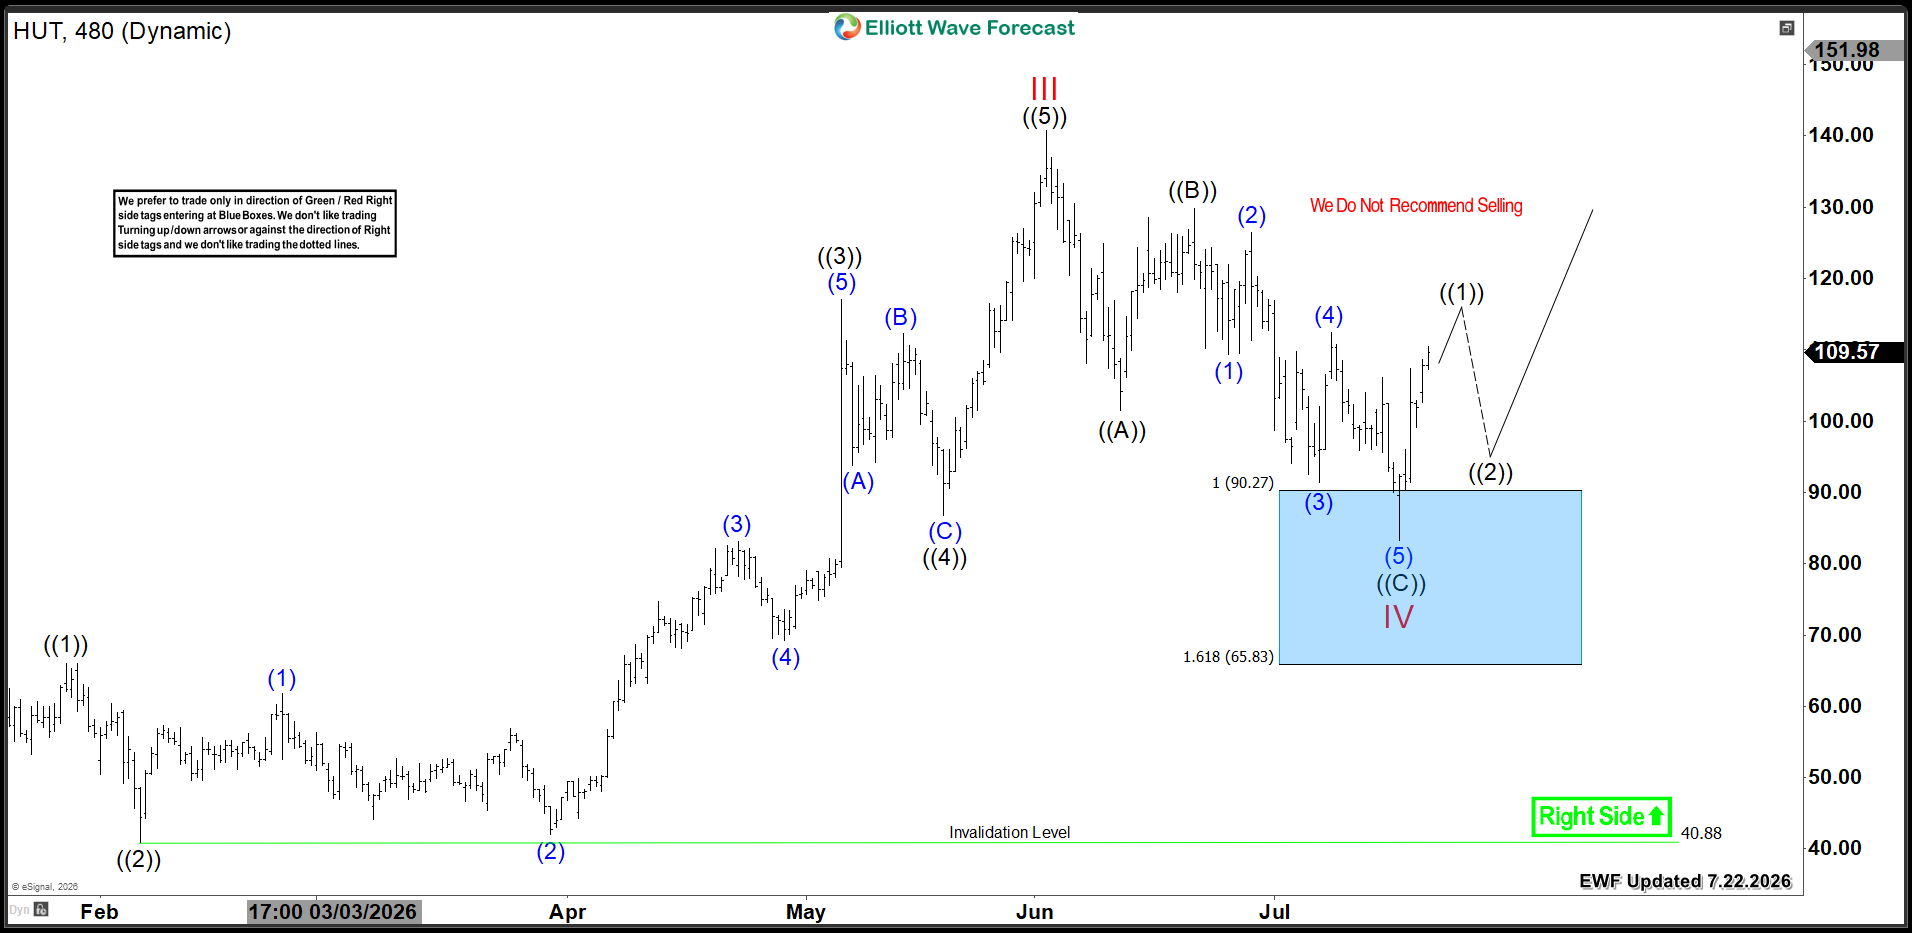
HUT completed a five-wave advance in wave III at $66.07 in June 2026. Since then, it formed a three-wave zigzag structure (A-B-C). Wave ((A)) ended at $101.5. Subsequently, wave ((B)) bounced to $129.88. Then, wave ((C)) traded lower into the buying Blue Box at the equal legs area $90.27 - $65.83 .
Wave IV is marked at the recent low of $83.30. From there, the stock is reacting to the upside. It will either resume the rally to new highs or bounce in three waves at minimum. As long as HUT stays above $83.30, it should aim for the upside target $154 - $176 .
However, if the stock fails to break into new highs, it could turn lower again. A double three correction in wave IV would then unfold. This would push HUT below $90 again. That would create another buying opportunity at the next extreme area.
HUT 8 Hour Chart 7.22.2026
The following video offers a technical outlook for HUT Corporation:
[video width="1280" height="622" mp4=""][/video]
Conclusion
HUT maintains a strong bullish trend. The stock appears ready for a new upside extension. However, bulls should remain cautious. Another dip remains a possibility.
免責事項:本記事で述べられている見解は著者の見解のみであり、Followmeの公式見解を反映するものではありません。Followmeは、提供された情報の正確性、完全性、信頼性について一切責任を負いません。また、書面で明示的に記載されている場合を除き、本記事の内容に基づいて行われたいかなる行動についても責任を負いません。

