


- AUD/USD recedes from 0.6900 to print two-day losing streak.
- MACD flirts with the bears, signals 100-bar SMA retest before highlight the key Fibonacci retracements.
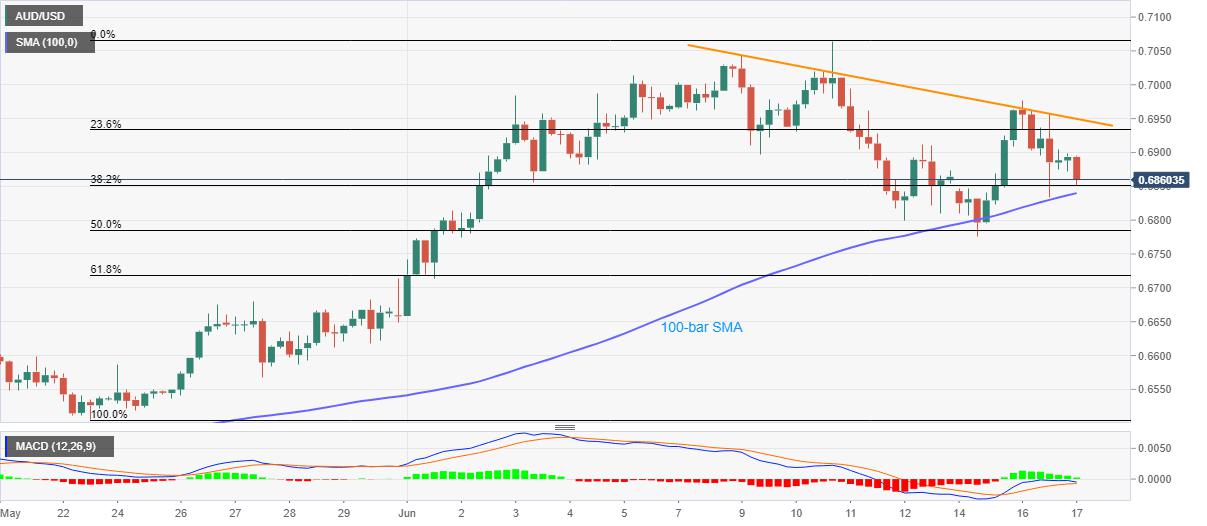
- A falling trend line from June 09 holds the door for the fresh run-up to challenge the monthly top.
AUD/USD bounces off intraday low of 0.6852 to 0.6863 during the early Wednesday’s trading session. Even so, the pair drops 0.36% on a day while printing a two-day losing streak by the press time.
The Aussie pair has recently been compressed by the weekly resistance line, which in turn tracks the MACD histogram that signals the receding strength of the buyers.
As a result, the quote could revisit a 100-bar SMA level of 0.6840 whereas the further declines depend upon how well it breaks 50% Fibonacci retracement level of its May 22-June 07 upside, also comprising the weekly low near 0.6775.
Should the AUD/USD prices remain weak past-0.6775, 61.8% Fibonacci retracement level near 0.6720 will be the key as a break of which could aim for May 27 high of 0.6680.
Meanwhile, the pair’s upside clearance of the said resistance line, at 0.6950 now, enables it to challenge the 0.7000 threshold. Additionally, a sustained rise beyond 0.7000 could easily refresh the monthly top surrounding 0.7065.
AUD/USD four-hour chart
Trend: Further downside expected
FXStreetから転載、著作権はすべて原作者に帰属します。
免責事項:本記事で述べられている見解は著者の見解のみであり、Followmeの公式見解を反映するものではありません。Followmeは、提供された情報の正確性、完全性、信頼性について一切責任を負いません。また、書面で明示的に記載されている場合を除き、本記事の内容に基づいて行われたいかなる行動についても責任を負いません。

