- GBP/USD extends recovery gains from 1.3020 while snapping a two-day losing streak.
- Bearish MACD, one-week-old faling trend line doubts the pair’s further upside.
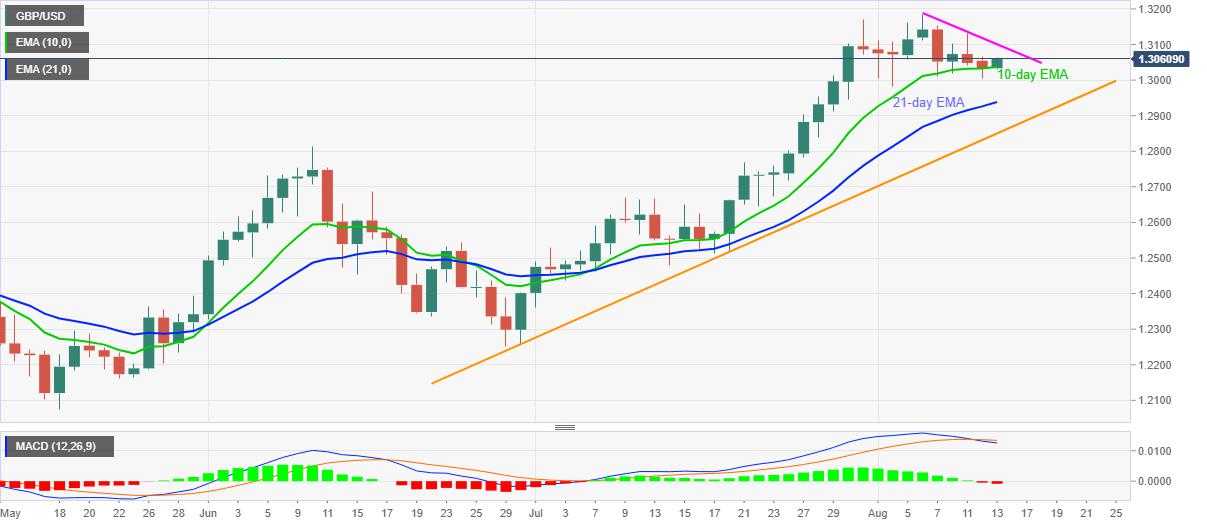
- 21-day EMA, a six-week-old support line add to the downside support.
GBP/USD recovers from 10-day EMA while trading near 1.3057, up 0.18% on a day, during the early Thursday’s Asian session. The Cable’s latest bounce ignores bearish MACD signals while aiming for a short-term resistance line.
However, the pair’s further upside beyond the said trend line resistance, at 1.3100 now, will need a strong push before attacking the monthly top around 1.3185 and March month’s peak surrounding 1.3200.
In a case where the bulls dominate past-1.3200, December 31, 2019 high close to 1.3285 can return to the chart.
Meanwhile, a downside break of 10-day EMA level of 1.3035 won’t call the bears immediately as 21-day EMA and an ascending trend line from June 30, respectively around 1.2935 and 1.2850, can still trigger the pair’s bounce.
GBP/USD daily chart
Trend: Bullish
FXStreetから転載、著作権はすべて原作者に帰属します。
免責事項:本記事で述べられている見解は著者の見解のみであり、Followmeの公式見解を反映するものではありません。Followmeは、提供された情報の正確性、完全性、信頼性について一切責任を負いません。また、書面で明示的に記載されている場合を除き、本記事の内容に基づいて行われたいかなる行動についても責任を負いません。

古いコメントはありません。ソファをつかむ最初のものになりましょう。