- AUD/NZD in on the verge of completing seven consecutive weeks of uninterrupted bullish closes.
- Bears are wathing the 4-hour chart like a hawk.
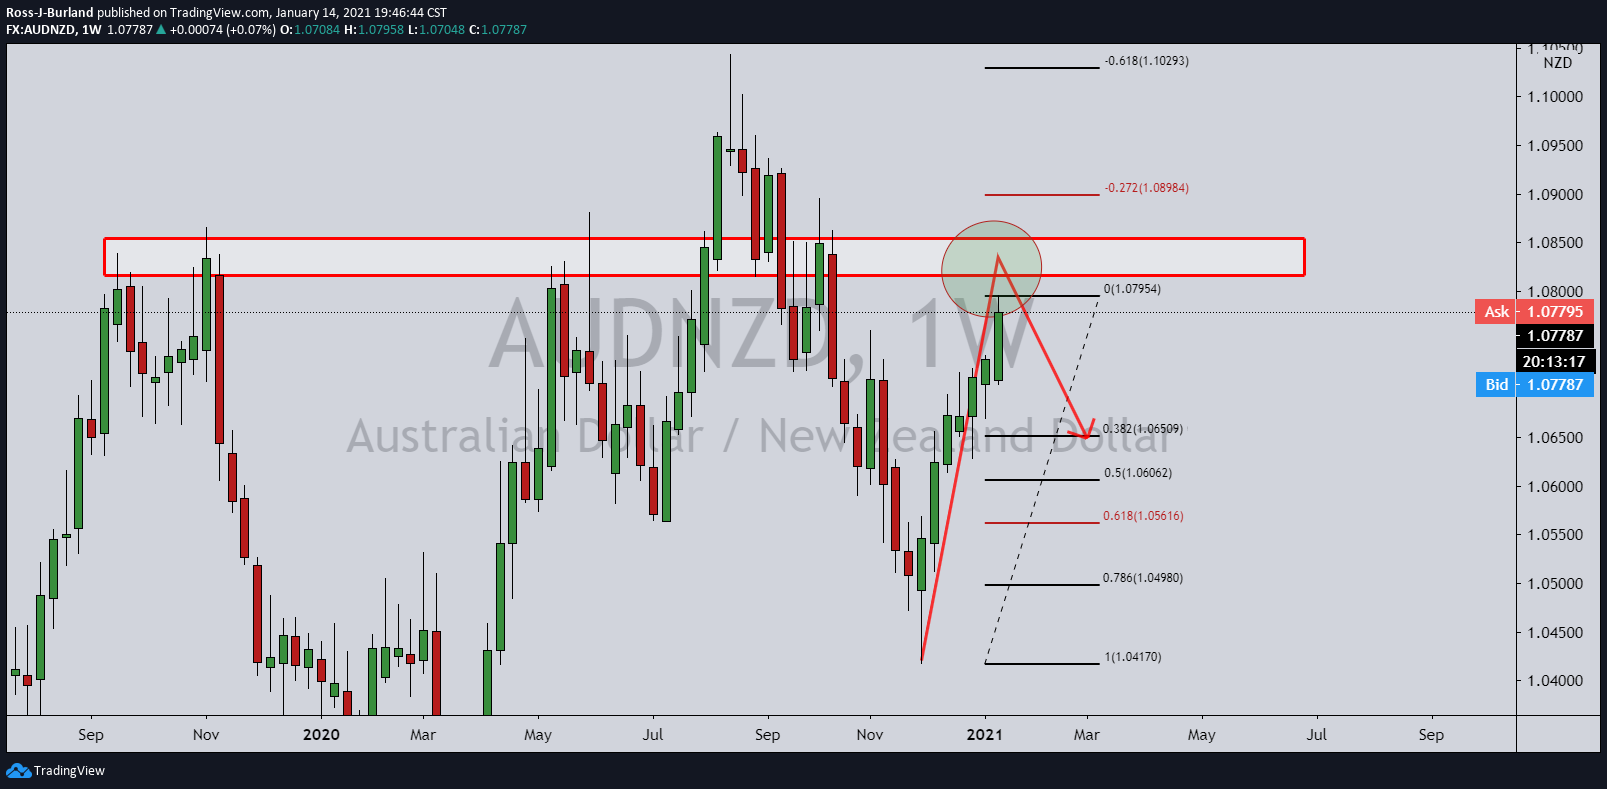
Further to the prior analysis, AUD/NZD Price Analysis: Bears target a 38.2% Fibo retracement, the bulls have still not given anything back in an uninterrupted series of higher closes on a weekly basis.
With just 20 hours to go until this weeks close, the pair is on track to complete its 7th higher closing week in a row. Something has got to give.
However, there is little on the charts, at least in terms of technical indicators, to say that this rally is about to correct anytime soon.
All of the technicals remain bullish from the monthly down to the 4-hour chart.
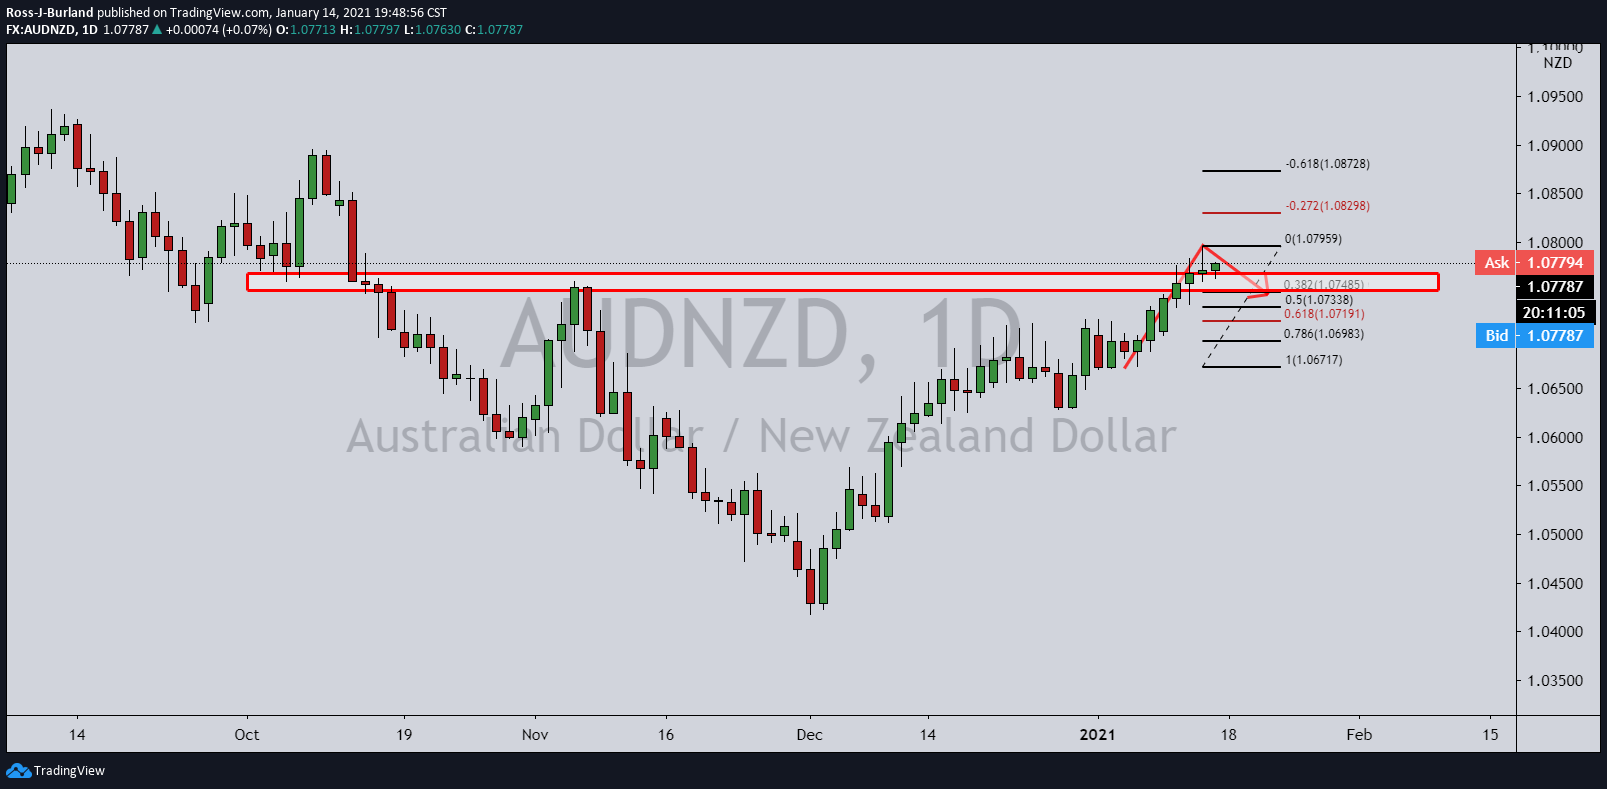
Daily chart
4-hour M-formation
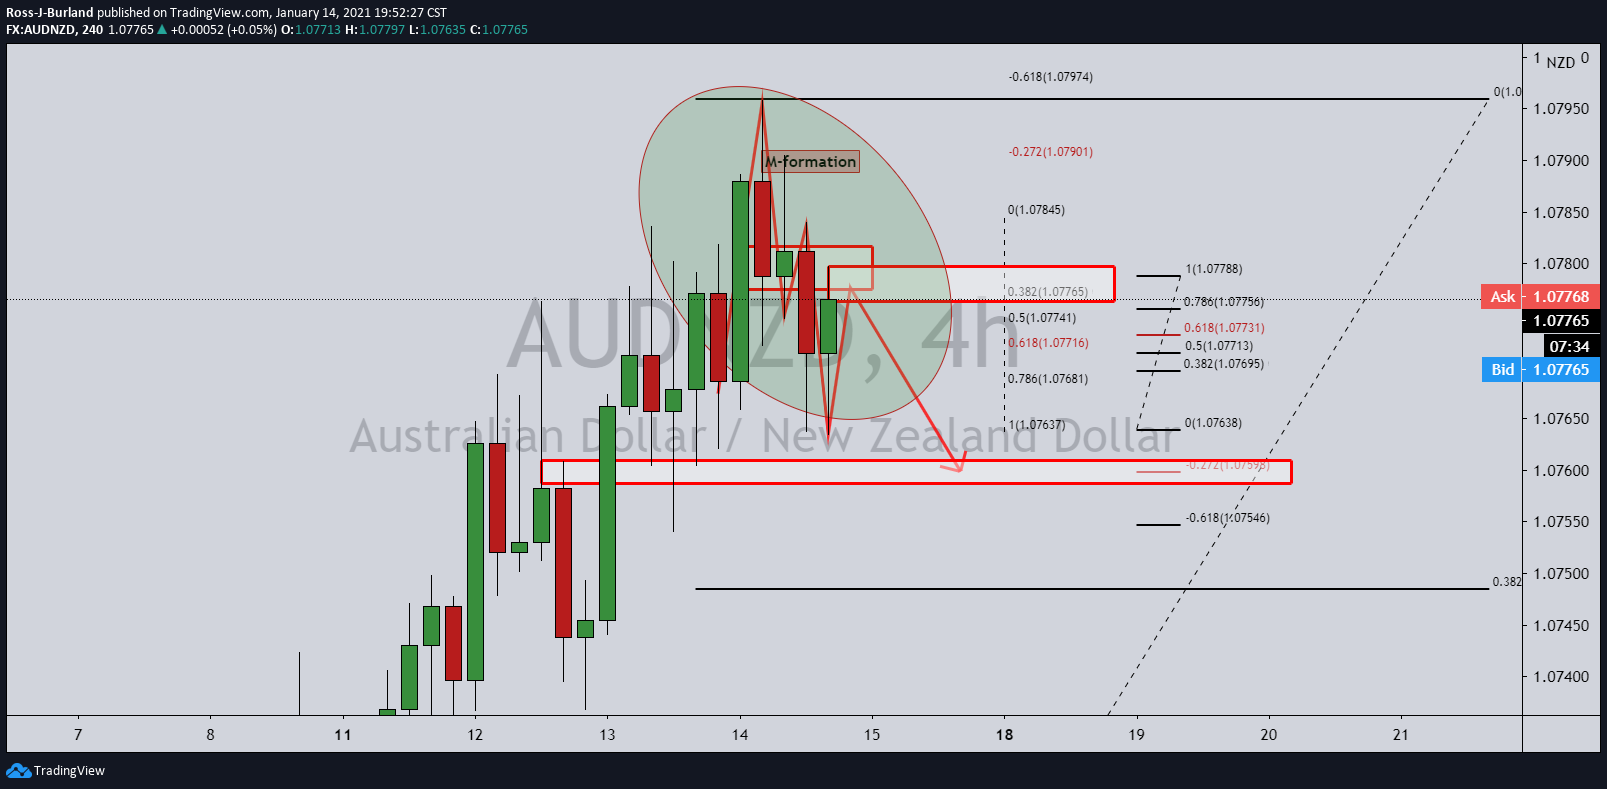
However, with the price completing an M-formation, the market would be expected to resist at this juncture and melt to the downside.
Could this be a turning point?
While the weekly target is located down in a 38.2% Fib retracement of the weekly impulse, the first stop meets the prior structure and a -0.272% Fibo of the recent correction to the W-formation's neckline and resistance.
FXStreetから転載、著作権はすべて原作者に帰属します。
免責事項:本記事で述べられている見解は著者の見解のみであり、Followmeの公式見解を反映するものではありません。Followmeは、提供された情報の正確性、完全性、信頼性について一切責任を負いません。また、書面で明示的に記載されている場合を除き、本記事の内容に基づいて行われたいかなる行動についても責任を負いません。

古いコメントはありません。ソファをつかむ最初のものになりましょう。