Market Context:
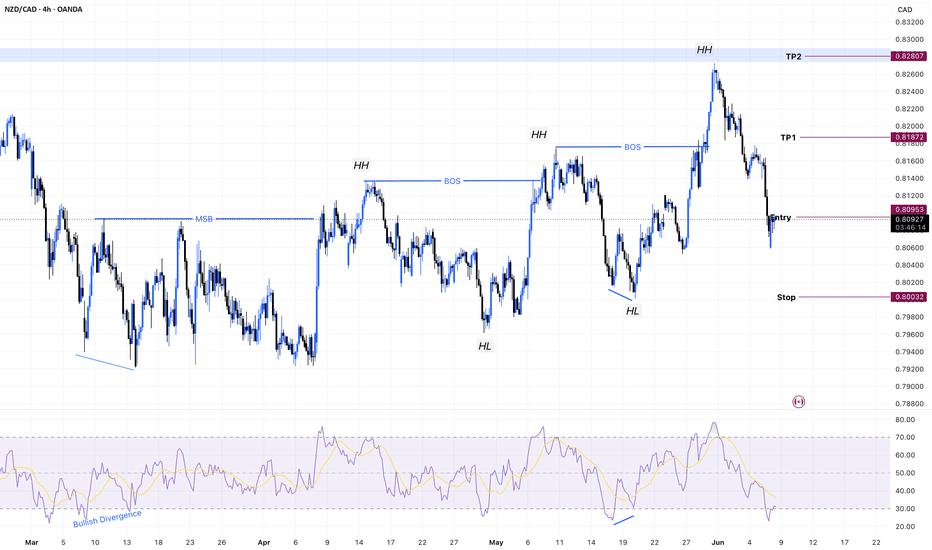
After bottoming out with a prominent Bullish RSI Divergence, NZDCAD executed a clean Market Structure Shift (MSS) by breaking its previous lower high. The buyers have firmly taken control, establishing a strong upward trend with three consecutive Higher Highs. The price is currently undergoing a healthy corrective retracement, offering a high-probability entry at a discounted structural level.
Technical Analysis:
Trend Transition: The clear shift from a bearish cycle to a series of consecutive Higher Highs confirms the validity of the new bullish regime.
Fibonacci Confluence: The price has pulled back precisely into the 0.618 Fibonacci Golden Zone. This area aligns structurally with the expectation of a new Higher Low formation before the next impulsive expansion.
Momentum Verification: The initial bullish divergence laid the foundation for this shift, and the current retracement allows the RSI to reset beautifully for the next leg up.
Trade Plan:
Entry Point: Long entry executed within the Fibonacci 0.618 retracement area.
Stop Loss (SL): Placed strictly below the Previous Higher Low to ensure proper trade invalidation if the bullish structure breaks.
Target (TP): Aiming for the Recent Swing High (Top High) to complete the next expansion phase.
Risk Management: Total trade exposure is strictly capped at 0.75% risk of account equity, adhering to a disciplined 1:1 minimum structural return.
Disclaimer: This analysis is for educational purposes only. Always monitor structural validation and candle close confirmation at key Fibonacci levels before trade execution.
免責事項:本記事で述べられている見解は著者の見解のみであり、Followmeの公式見解を反映するものではありません。Followmeは、提供された情報の正確性、完全性、信頼性について一切責任を負いません。また、書面で明示的に記載されている場合を除き、本記事の内容に基づいて行われたいかなる行動についても責任を負いません。

古いコメントはありません。ソファをつかむ最初のものになりましょう。