


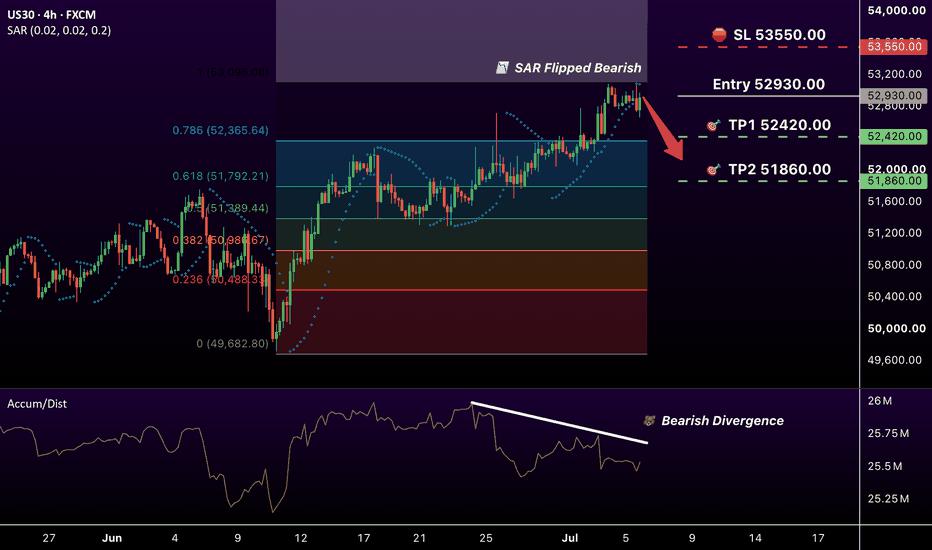
📊 Trade Plan:
🔻 Entry: 52930
🛑 Stop Loss: 53550
🎯 Take Profit 1: 52420 (above 0.786 Fib)
🎯 Take Profit 2: 51860 (above 0.618 Fib)
📉 Technical Picture (H4 & Daily):
Parabolic SAR: Dots have flipped above price. Trend signal turned bearish.
Accumulation/Distribution: Divergence — price making higher highs, A/D making lower highs. Smart money distributing, not accumulating.
Fibonacci: Grid drawn from swing low to swing high. TP1 sits just above the 0.786 level, TP2 just above 0.618.
🗞️ Fundamental Note:
Dow futures are climbing after weak NFP data tempered September rate hike expectations — now at 45%, down from 48.3% a week ago. The Dow rallied nearly 2% last week to fresh records, driven by defensive sectors. But FOMC Minutes Wednesday could shift the narrative.
❌ Invalidation:
A daily close above 53550 invalidates the Parabolic SAR flip and voids the short setup.
免責事項:本記事で述べられている見解は著者の見解のみであり、Followmeの公式見解を反映するものではありません。Followmeは、提供された情報の正確性、完全性、信頼性について一切責任を負いません。また、書面で明示的に記載されている場合を除き、本記事の内容に基づいて行われたいかなる行動についても責任を負いません。

