


XAU/USD (Gold) 15-Minute Technical Analysis
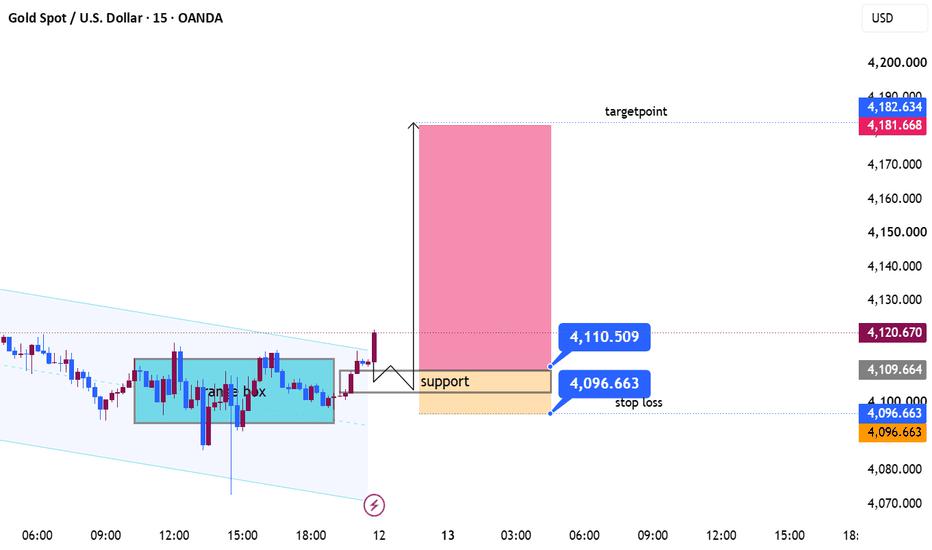
The chart shows gold breaking above a consolidation range (range box) and attempting to confirm a bullish continuation. Price has also pushed above the descending trendline, indicating buyers are gaining control.
Market Structure
Trend: Short-term bullish.
Breakout: Price has broken above the range resistance around 4109–4111, signaling a potential continuation move.
Retest Zone: The highlighted support area (4109–4097) is the key demand zone. A successful retest here would strengthen the bullish setup.
Key Levels
Immediate Resistance: 4121–4125 (current swing high area).
Support: 4109.5 (breakout level).
Major Support / Stop Loss: 4096.6 (below the demand zone).
Bullish Target: 4181.7, which aligns with the projected measured move shown on the chart.
Liquidity Analysis
Buy-side Liquidity: Above 4121. If price clears this high, it could trigger stop orders from sellers and accelerate toward higher levels.
Sell-side Liquidity: Around 4097–4100. A dip into this zone may sweep liquidity before buyers step back in.
Trading Scenario
Bullish Case (Preferred)
Wait for a pullback into 4109–4100.
Watch for bullish confirmation (strong rejection candle, bullish engulfing, or higher low).
Entry: Near 4109–4105 after confirmation.
Stop Loss: 4096.6.
Targets:
TP1: 4125
TP2: 4150
TP3: 4181.7
Bearish Invalidation
A sustained close below 4096.6 would invalidate the breakout and increase the probability of a move back into the previous range around 4085–4075.
Overall Bias
The technical structure favors bullish continuation as long as price remains above the 4096.6 support. A healthy retest of the breakout zone could offer a higher-probability long opportunity, while a decisive break below support would shift momentum back to the bears.
免責事項:本記事で述べられている見解は著者の見解のみであり、Followmeの公式見解を反映するものではありません。Followmeは、提供された情報の正確性、完全性、信頼性について一切責任を負いません。また、書面で明示的に記載されている場合を除き、本記事の内容に基づいて行われたいかなる行動についても責任を負いません。

