


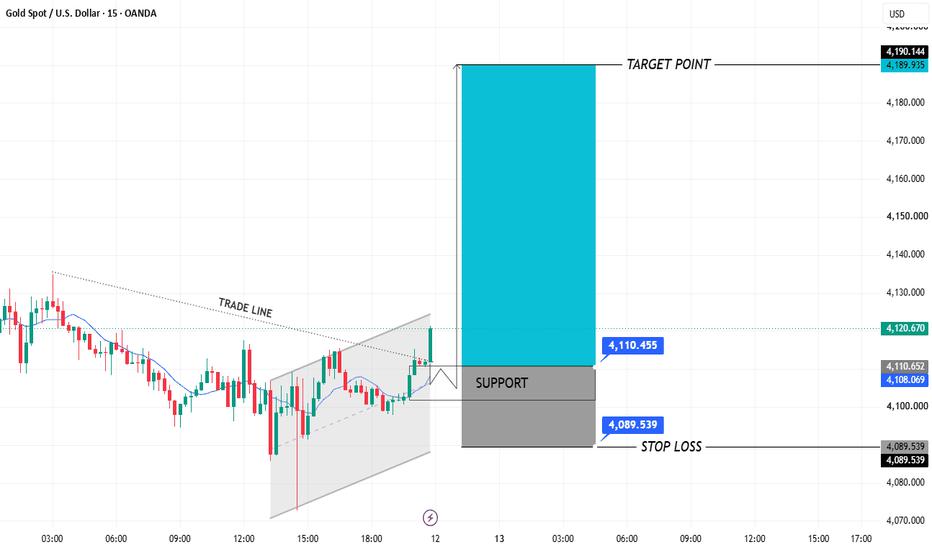
AU/USD 15M Analysis
Bullish Bias
Ascending Triangle Breakout
Market Structure
Trend: Short-term bullish.
Pattern: Price has been consolidating inside an ascending triangle / rising channel.
Breakout: A strong bullish candle has broken above the descending trade line, signaling buyers are gaining control.
Momentum: Consecutive higher lows suggest accumulation before the breakout.
Key Levels
Entry / Support Zone
4108.07 - 4110.45
4108.074110.45
This area acts as immediate support after the breakout.
Resistance / Target
4189.90 - 4190.14
4189.904190.14
This is the projected upside target shown on the chart.
Stop Loss
4089.54
4089.54
A break below this level would invalidate the bullish setup.
Trade Idea (Educational)
Bullish Scenario
Buy on a retest of 4108-4110
Stop Loss: 4089.54Target: 4189-4190
Alternative Scenario
If price closes back below 4108
The breakout may fail.Expect a move toward 4100 and possibly the 4090 support region.
Liquidity & Price Action
Liquidity above recent highs: The market may attempt to sweep the highs before continuing higher.
Retest behavior: A healthy breakout often revisits the broken trendline/support zone before expanding upward.
Risk-to-reward: The setup offers a favorable RR if entries are taken near support rather than after a large impulsive candle.
Bias Summary
Bias
BULLISH
Timeframe
15 Minutes
Support4108-4110
Invalidation4089.54
Target4189-4190
Overall Bias: BULLISH while price holds above the 4108 support zone, with 4190 as the main upside target.
This analysis is for educational purposes and not financial advice.
免責事項:本記事で述べられている見解は著者の見解のみであり、Followmeの公式見解を反映するものではありません。Followmeは、提供された情報の正確性、完全性、信頼性について一切責任を負いません。また、書面で明示的に記載されている場合を除き、本記事の内容に基づいて行われたいかなる行動についても責任を負いません。

