


SMC Trading point update
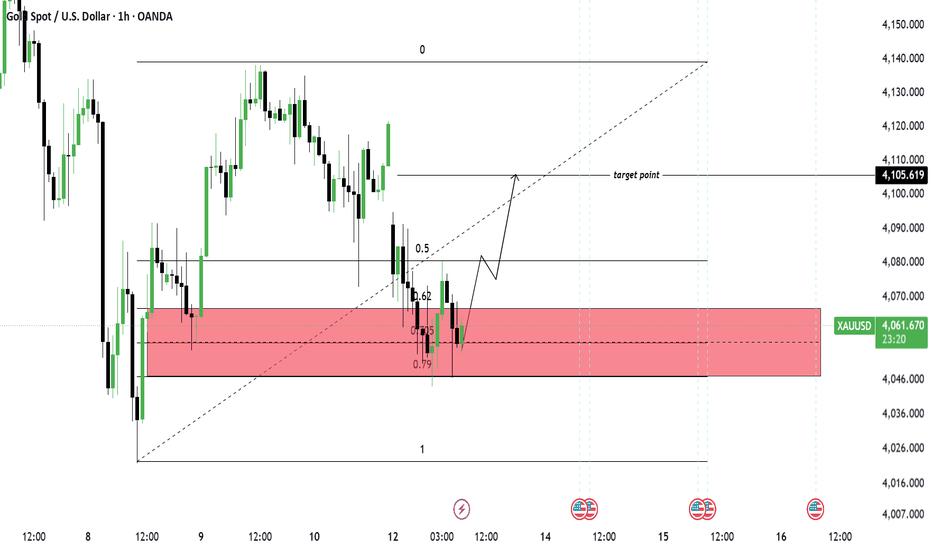
Chart Overview
• Pair: Gold Spot / USD - 1 Hour timeframe
• Current price: $4,062.43
• Date: Jul 13, 2026 07:25 UTC-5
• Bias on chart: Bullish pullback → continuation up
Key Levels Marked
1. Major Demand Zone - RED BOX: $4,046 - $4,066
Price just wicked into the 0.705 - 0.79 fib area inside this zone and bounced. This is strong confluence: fib + horizontal demand + diagonal trendline support.
2. Fib Retracement: Drawn from swing low to swing high
• 0.5: $4,080
• 0.62: $4,070
• 0.705 - 0.79: Inside the red demand box
• 0: $4,140
3. Target Point: $4,105.61
This lines up just under the previous 1H supply and the diagonal resistance.
Me SMC trading point
4. Diagonal Trendline: Rising support from the swing low. Price tapped it and reacted up.
The Idea on the Chart
The arrow shows the expected move:
1. Buy from demand: Reaction off $4,046 - $4,066 zone + trendline
2. First Target: $4,080 - 0.5 fib
3. Main Target: $4,105 - Previous 1H supply / "target point"
This is a classic SMC "buy in discount" setup. Price came to demand, took liquidity below, and is now pushing up.
dipcrschn Signal Format
• Bias: Bullish above $4,046
• Buy Zone: $4,050 - $4,065
• SL: Below $4,040 - under the zone + structure
• TP1: $4,080
• TP2: $4,105
• Invalidation: 1H close below $4,046 flips bias bearish
Please boost this analysis
免責事項:本記事で述べられている見解は著者の見解のみであり、Followmeの公式見解を反映するものではありません。Followmeは、提供された情報の正確性、完全性、信頼性について一切責任を負いません。また、書面で明示的に記載されている場合を除き、本記事の内容に基づいて行われたいかなる行動についても責任を負いません。

