


📊 GBP/USD Technical Analysis 🔥📉
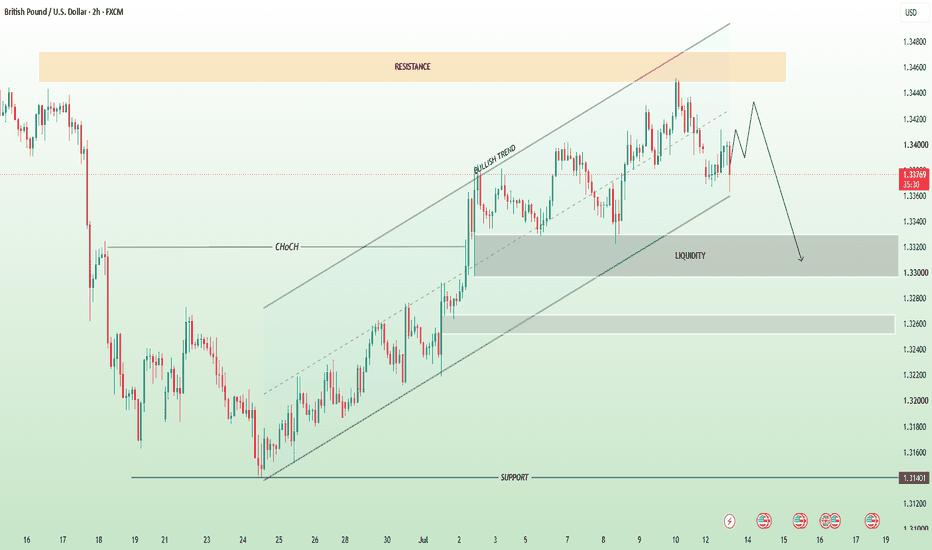
GBP/USD is approaching a key decision zone after rejecting the major resistance area around 1.3450–1.3460. Price remains inside the bullish structure, but momentum is weakening as sellers begin to defend the highs.
🟠 Key Market Outlook
✅ Overall trend remains bullish inside the ascending channel.
🚫 Strong rejection from the major resistance zone signals potential exhaustion.
📉 A short-term pullback is likely before the next major move.
💧 The highlighted liquidity zone (1.3300–1.3320) is the primary bearish target if selling pressure increases.
🔄 A temporary bounce may occur before continuing lower, following the projected path.
🎯 Trading Scenario
📍 Resistance: 1.3450 – 1.3460
📍 Current Bias: Bearish Pullback
🎯 Target 1: 1.3360
🎯 Target 2: 1.3320 (Liquidity Zone)
🛑 Invalidation: Strong breakout and sustained close above 1.3460 could resume the bullish trend.
⚠️ Conclusion:
The chart suggests a bearish correction from resistance toward the liquidity zone while the broader bullish structure remains intact. Watch price action closely around support for confirmation before the next directional move. 📈📉
免責事項:本記事で述べられている見解は著者の見解のみであり、Followmeの公式見解を反映するものではありません。Followmeは、提供された情報の正確性、完全性、信頼性について一切責任を負いません。また、書面で明示的に記載されている場合を除き、本記事の内容に基づいて行われたいかなる行動についても責任を負いません。

