


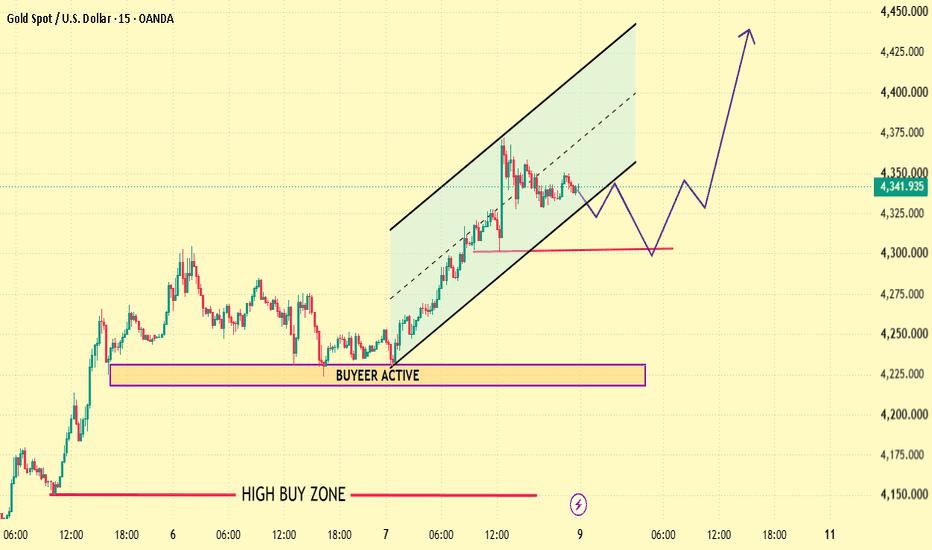
The chart shows Gold moving inside an ascending channel after establishing strong upward momentum. The lower channel boundary has been respected several times, creating a clear dynamic support structure.
The marked zone around 4300–4305 is positioned below current price and can be used as a key technical reference during any pullback.
Market Structure
Higher Highs ✅
Higher Lows ✅
Rising Channel ✅
Price Above Key Zone ✅
Reference Levels
4320 — short-term support
4300–4305 — key support zone
4360 — first resistance
4380 — second resistance
4420 — major resistance
4440 — extended level
Possible Path
4342 → 4360 → 4380 → 4420 → 4440
免責事項:本記事で述べられている見解は著者の見解のみであり、Followmeの公式見解を反映するものではありません。Followmeは、提供された情報の正確性、完全性、信頼性について一切責任を負いません。また、書面で明示的に記載されている場合を除き、本記事の内容に基づいて行われたいかなる行動についても責任を負いません。

