


· Views 2,528
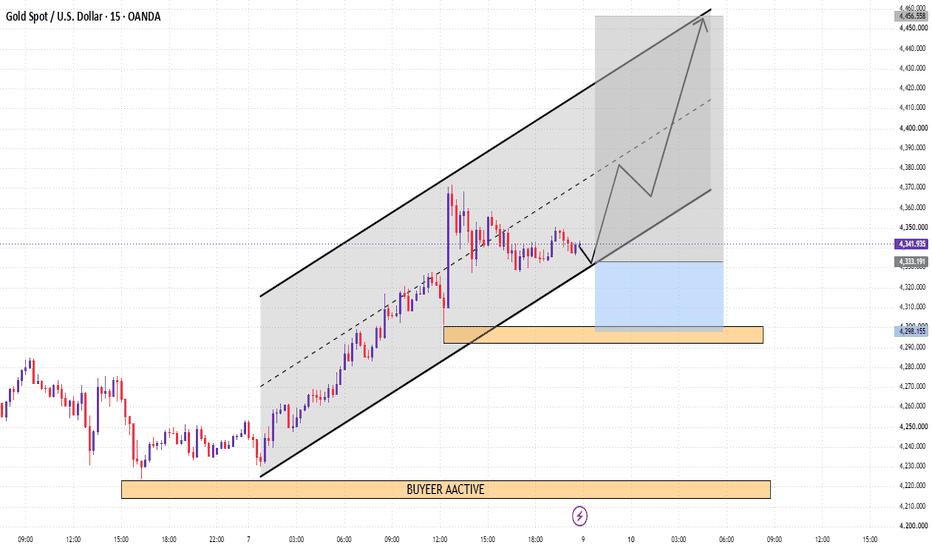
Gold continues to display a well-organized upward structure on the M15 chart. The move from the lower demand area produced multiple higher lows and eventually pushed price toward the 4340 region.
At present, price is consolidating after the latest advance. The rising channel provides the main structural framework, while the 4300–4305 zone acts as an important horizontal reference.
Price Map
📍 Current: ~4342
📍 Support: 4320
📍 Key Zone: 4300–4305
📍 Resistance: 4360
📍 Resistance: 4380
📍 Major Level: 4420
📍 Extended Level: 4440
Potential Progression
4360 → 4380 → 4420 → 4440
免責事項:本記事で述べられている見解は著者の見解のみであり、Followmeの公式見解を反映するものではありません。Followmeは、提供された情報の正確性、完全性、信頼性について一切責任を負いません。また、書面で明示的に記載されている場合を除き、本記事の内容に基づいて行われたいかなる行動についても責任を負いません。
この記事が気に入ったら、著者にチップを送って感謝の気持ちを表しましょう。

