


XAGUSD 1H Bullish Breakout Setup 📈
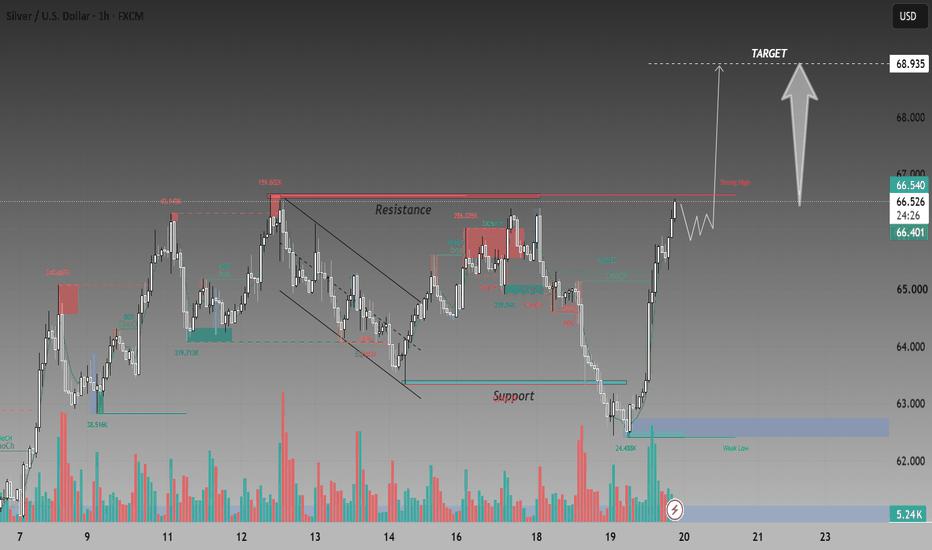
Silver is showing strong bullish momentum on the 1H chart after recovering sharply from the 62.50–63.00 support area. Price has formed a strong upward move with consecutive bullish candles and has now returned to the major 66.40–66.60 resistance zone. The current structure suggests that buyers are attempting to break above the previous strong high, which could open the door for another bullish continuation toward the 68.935 target.
🟢 Bullish Scenario:
The bullish outlook remains valid as long as XAGUSD holds above the recently broken structure and continues to print higher highs and higher lows. A sustained 1H candle close above the 66.50–66.60 resistance area would provide stronger confirmation that buyers have successfully taken control.
After a confirmed breakout, a retest of the 66.40–66.60 region could act as a potential support area. If price holds this zone and produces another bullish reaction, the next upside objective would be around 67.50, followed by the major target near 68.935.
🎯 Bullish Targets:
• Breakout zone: 66.50–66.60
• TP1: 67.00–67.50
• TP2: 68.00
• TP3: 68.935
• Extended target: above 69.00 if bullish momentum accelerates
🔴 Bearish Scenario:
The bullish setup could weaken if price fails to maintain the breakout and produces a strong rejection from the 66.50–66.60 resistance area. A move back below 66.00 would indicate that buyers are losing short-term control, while a sustained break below 65.00 could create a deeper corrective move.
The first downside area to watch would be around 65.00–64.50. If sellers gain further momentum, the marked support around 63.30–63.40 becomes an important zone. A break below this support would invalidate the immediate bullish structure and could expose the 62.50–62.80 weak-low region.
🎯 Bearish Targets:
• TP1: 65.50–65.00
• TP2: 64.00–63.40
• TP3: 62.80–62.50
• Extended bearish target: below 62.50 if major support fails
📌 Key Technical Points:
• XAGUSD has made a strong recovery from the 62.50–63.00 support region.
• The recent price action shows strong bullish momentum and aggressive buying.
• The 66.40–66.60 region is the key resistance area on the chart.
• A confirmed breakout above the strong high would strengthen the continuation setup.
• 66.00 can act as an important short-term level after the breakout.
• A successful retest of the breakout zone would provide stronger bullish confirmation.
• 67.00 and 67.50 are intermediate upside areas to monitor.
• 68.935 is the main bullish target marked on the chart.
• The 63.30–63.40 region remains an important structural support zone.
• The 62.50–62.80 area represents the recent weak-low/support region.
• Strong volume during the breakout would add confidence to the bullish continuation.
• A failed breakout followed by a bearish candle close back below resistance would warn of a possible correction.
📊 Trading Perspective:
From a trading perspective, XAGUSD is approaching a major decision area after a powerful recovery. Buyers have already demonstrated strong momentum by moving price rapidly from the lower support region toward the 66.50 resistance area. However, because price is now close to a previous strong high, chasing the move without confirmation can increase risk.
A more conservative bullish approach would be to wait for a clean 1H close above 66.50–66.60 and then monitor the retest. If the former resistance holds as support and buyers return, the continuation toward 67.50, 68.00 and ultimately 68.935 becomes more attractive.
On the other hand, if price repeatedly rejects the 66.50–66.60 zone and falls back below 66.00, the bullish momentum could temporarily weaken. A deeper move below 65.00 would increase the probability of a corrective decline toward 64.00–63.40.
⚠️ Risk Management:
The key invalidation for the immediate bullish idea is a sustained failure above the resistance zone followed by a breakdown of important short-term support. Traders should avoid entering solely because price is rising and should wait for confirmation from candle closes, structure and retests. Position size should be controlled according to the distance between entry and invalidation, especially because silver can experience sharp intraday movements.
📈 Overall Outlook:
The overall chart structure favors the bullish side while XAGUSD maintains its higher-high and higher-low formation and holds above the important support zones. The main trigger is a confirmed breakout above 66.50–66.60. If buyers secure this breakout and successfully defend the retest, the path toward 67.50, 68.00 and 68.935 could become increasingly likely.
However, rejection from resistance and a move below 66.00 would signal short-term weakness, while a deeper break below 65.00 could shift attention toward 64.00–63.40 and potentially 62.50. The key battle is therefore between the 66.50–66.60 resistance and the underlying support structure.
📌 Key levels to watch: 66.50–66.60 resistance → 67.50 → 68.00 → 68.935 bullish targets | 66.00 → 65.00 → 63.40 → 62.50 bearish levels.
This setup should be treated as a technical scenario rather than a guaranteed outcome; confirmation and disciplined risk management remain essential. 📊
免責事項:本記事で述べられている見解は著者の見解のみであり、Followmeの公式見解を反映するものではありません。Followmeは、提供された情報の正確性、完全性、信頼性について一切責任を負いません。また、書面で明示的に記載されている場合を除き、本記事の内容に基づいて行われたいかなる行動についても責任を負いません。

