


· Views 887
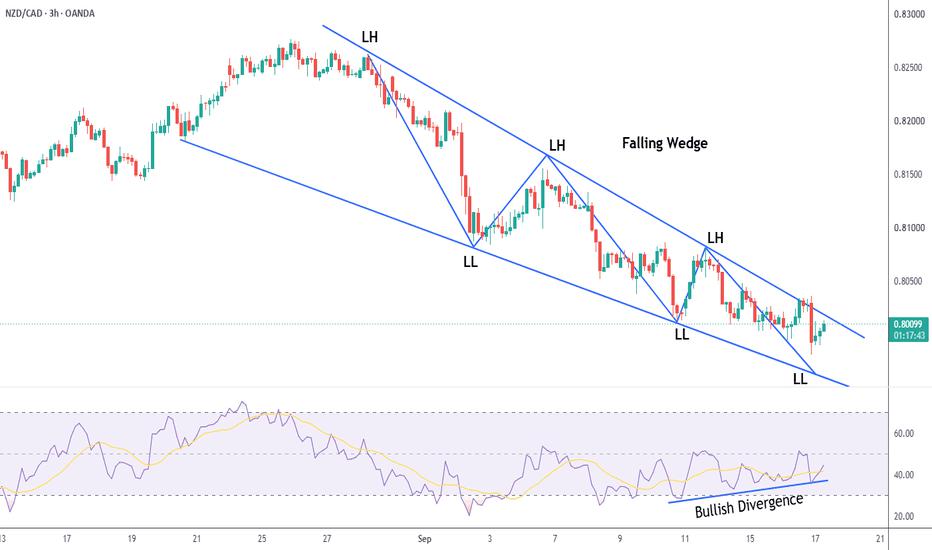
NZDCAD is currently forming a Falling Wedge on the 3H timeframe, accompanied by Bullish RSI Divergence.
The divergence suggests that downside momentum is weakening, while the wedge structure indicates a potential shift in market direction. A confirmed breakout above the wedge could provide further evidence of a possible bullish reversal.
Key focus: Breakout confirmation before considering any directional move.
Risk management remains the priority.
免責事項:本記事で述べられている見解は著者の見解のみであり、Followmeの公式見解を反映するものではありません。Followmeは、提供された情報の正確性、完全性、信頼性について一切責任を負いません。また、書面で明示的に記載されている場合を除き、本記事の内容に基づいて行われたいかなる行動についても責任を負いません。
この記事が気に入ったら、著者にチップを送って感謝の気持ちを表しましょう。

