


Price
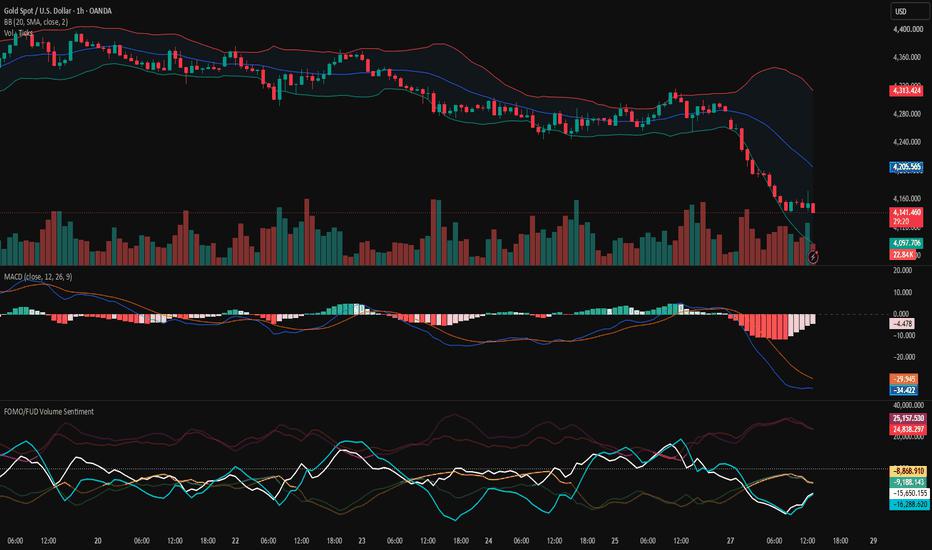
Gold is trading around 4,147 on the 1H chart after a sharp decline and subsequent sideways movement near the lower Bollinger Band area. On the 1D chart, the current candle is trading below the lower Bollinger Band.
Volume Sentiment
1H: The raw and Heikin-Ashi Volume Sentiment lines are moving upward together, but both remain in the FUD zone. This shows short-term improvement in the buyer/seller balance while selling pressure remains elevated.
1D: The raw Volume Sentiment line remains negative, indicating a relative seller majority. The Heikin-Ashi line is also in the FUD zone and has been moving downward since crossing below its lower threshold around three candles ago.
MACD
1H: The MACD fast line has slowed its downward movement and is moving closer to the slower line. The histogram is recovering from negative levels, showing improving short-term momentum, although no crossover has occurred.
1D: Both MACD lines remain in negative territory, with the fast line below the slower line. The histogram remains negative, showing persistent weaker momentum on the higher timeframe.
Bollinger Bands
1H: Price was near the lower Bollinger Band around six candles ago and has since moved sideways.
1D: Price has been trading below the Bollinger midline with relatively narrow bands. The current daily candle is below the lower Bollinger Band; as the candle is still open, this observation may change before the daily close.

The 1H view shows short-term improvement in Volume Sentiment and momentum, while the 1D view remains dominated by weaker Volume Sentiment and negative MACD conditions. This shows improving short-term conditions, but not a confirmed change in direction.
This analysis serves as a starting snapshot for the week. The Friday update will revisit these conditions and assess what has changed from this initial state.
This is a market-data observation, not a prediction of future price movement. Conditions can change quickly with new market information.
Not financial advice. Do your own analysis and risk management.
免責事項:本記事で述べられている見解は著者の見解のみであり、Followmeの公式見解を反映するものではありません。Followmeは、提供された情報の正確性、完全性、信頼性について一切責任を負いません。また、書面で明示的に記載されている場合を除き、本記事の内容に基づいて行われたいかなる行動についても責任を負いません。

-終わり-