
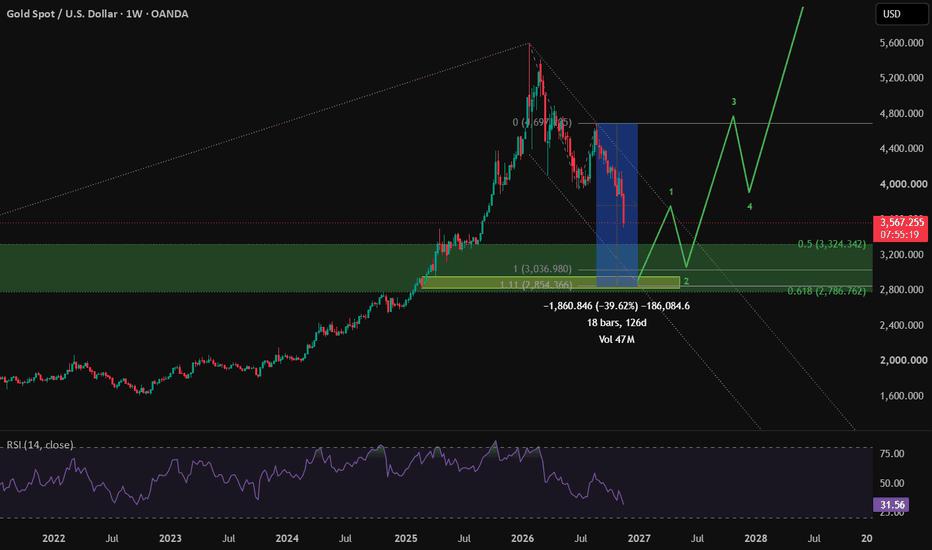
XAU/USD is undergoing a sharp corrective pullback toward a major Fibonacci demand zone between $2,786 and $3,324 before an anticipated multi-wave bullish continuation.
Chart Breakdown & Price Action
• Current Weekly Candle: Gold is trading around $3,571.05, down roughly 8.07% (-$313.63) for the week (opening at $3,885.63, high of $3,901.37, low of $3,514.56). This marks a significant correction from the peak near $4,697.
• Momentum (RSI 14): The weekly Relative Strength Index sits at 31.63, approaching the oversold threshold (30). This indicates strong short-term bearish momentum, though selling pressure is nearing exhaustion levels where historical buyers have stepped in.
Key Technical Levels
• Major Demand / Support Zone (Green Box): ~$2,786 – $3,324
• 0.5 Fibonacci Retracement: $3,324.34 (upper boundary of the target zone).
• 1.0 Fib / Structural Support: $3,036.98.
• 1.11 Extension / 0.618 Macro Fib: $2,854.37 – $2,786.76 (lower boundary of the demand zone). The chart's measurement tool highlights a potential total drawdown of roughly -39.62% (-$1,860) from the highs into this base.
• Overhead Resistance: Immediate psychological and structural resistance sits near $3,818 – $3,900 (current week's high), followed by the prior peak around $4,697.
免責事項:本記事で述べられている見解は著者の見解のみであり、Followmeの公式見解を反映するものではありません。Followmeは、提供された情報の正確性、完全性、信頼性について一切責任を負いません。また、書面で明示的に記載されている場合を除き、本記事の内容に基づいて行われたいかなる行動についても責任を負いません。